Text description of PowerPoint slides for Knowledge Production
advertisement
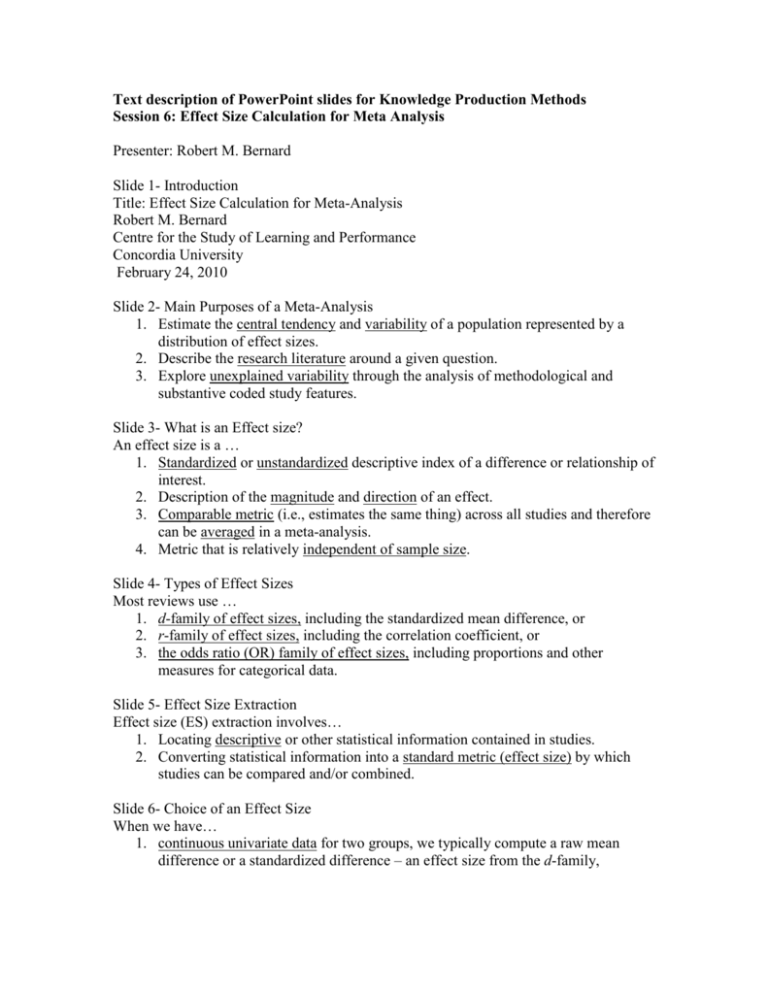
Text description of PowerPoint slides for Knowledge Production Methods Session 6: Effect Size Calculation for Meta Analysis Presenter: Robert M. Bernard Slide 1- Introduction Title: Effect Size Calculation for Meta-Analysis Robert M. Bernard Centre for the Study of Learning and Performance Concordia University February 24, 2010 Slide 2- Main Purposes of a Meta-Analysis 1. Estimate the central tendency and variability of a population represented by a distribution of effect sizes. 2. Describe the research literature around a given question. 3. Explore unexplained variability through the analysis of methodological and substantive coded study features. Slide 3- What is an Effect size? An effect size is a … 1. Standardized or unstandardized descriptive index of a difference or relationship of interest. 2. Description of the magnitude and direction of an effect. 3. Comparable metric (i.e., estimates the same thing) across all studies and therefore can be averaged in a meta-analysis. 4. Metric that is relatively independent of sample size. Slide 4- Types of Effect Sizes Most reviews use … 1. d-family of effect sizes, including the standardized mean difference, or 2. r-family of effect sizes, including the correlation coefficient, or 3. the odds ratio (OR) family of effect sizes, including proportions and other measures for categorical data. Slide 5- Effect Size Extraction Effect size (ES) extraction involves… 1. Locating descriptive or other statistical information contained in studies. 2. Converting statistical information into a standard metric (effect size) by which studies can be compared and/or combined. Slide 6- Choice of an Effect Size When we have… 1. continuous univariate data for two groups, we typically compute a raw mean difference or a standardized difference – an effect size from the d-family, 2. continuous bivariate data, we typically compute a correlation (from the r-family), or 3. binary data (the patient lived or died, the student passed or failed), we typically compute an odds ratio, a risk ratio, or a risk difference. Slide 7- d-Family: Zero Effect Size Graph showing distributions with Control Condition and Treatment Condition are the overlapping when the effect size is 0 Slide 8- d-Family: Moderate Effect Size Graph showing distributions with an Effect Size of .40 where the control condition is slightly separate from the treatment condition Slide 9- d-Family: Large Effect Size Graph showing distributions with an Effect Size of .85 where the control condition is further apart from the treatment condition than in slide 8 Slide 10: Effect Size Interpretation Chart showing small, medium, and large effect size standards. The cut-off points between small, medium, and large effect sizes are approximate .10-.34 is considered small effect size .34-.70 is considered a medium effect size .70-1 is considered large effect size Citation: Cohen, J. (1988). Statistical power analysis for the behavioral sciences (2nd ed.). Hillsdale, NJ: Lawrence Erlbaum Associates. Slide 11- Research designs for d-Family Statistics Table showing the following research designs and the experimental condition: 1. Independent groups with only a posttest have an experiment condition and a post test 2. One-group designs have a pretest, an experiment and a posttest 3. Independent groups with pre and post tests have a pretest, experiment, and posttest along with a pretest, a control group, and a post test to compare. Slide 12- Statistics for d-Family Effect Size Extraction Effect sizes can be extracted using the following reported statistics: 1. Descriptive statistics (means, SDs, sample sizes) Preferred (by far). 2. Exact test statistics (t-values, F-values, etc.) 3. Exact probability values (p = .013, etc.) 4. Approximate comparisons of p to α (p < .05, etc.) By far, the least exact. Slide 13- d-Family with Independent Groups (Basic Equation) Slide shows three equations for d-family with independent groups. Slide 14 - d Family Statistics: Means and Standard Deviations Equation to determine means and standard deviations using study report data as an example Slide 15- Alternative Methods of ES Extraction: t-values and F-ratios Equations to show different ways to determine t-values and F-ratios Slide 16- Alternative Methods of ES Extraction: Exact p-value Equation to show exact probability by looking up the t-value. Slide 17- Alternative Methods of ES Extraction: p < α Equation showing how to find an approximate effect size Slide 18-d Family: Adjustment for Small Samples Equation described that was developed by Cohen to apply a correction for small sample size bias. Cohen’s d tends to overestimate ES in small samples and Hedges’ g corrects this (Hedges & Olkin, 1985). Hedges’ g equation described. Slide 19- d-Family Statistics with dependent Groups (pre-post) One equation shows how to find exact effect size with pretest and posttest means and standard deviations. A second equation shows how to find the effect size when one has the difference from the pretest and the posttest scores and the standard deviation of the posttest. Slide 20- Relationship Between Effect Size and Pre-Post Correlation Graph showing the Effect size and Correlation relationship. Slide 21- d-Family Statistics with Independent Groups (pre-post) Equation showing how to find the effect size when one knows the pretest and posttest scores and the standard deviations of both reports. Slide 22- Calculating Standard Error The standard error of g is an estimate of the “standard deviation” of the population, based on the sampling distribution of an infinite number of samples all with a given sample size. Smaller samples tend to have larger standard errors and larger samples have smaller standard errors. Equation showing how to find the Standard Error with a pretest and posttest Slide 23- 95th% Confidence Interval The 95th Confidence Interval is the range within which it can be stated with reasonable confidence that the true population mean exists. As the standard error decreases (the sample size increases), the confidence interval decreases in width. Conclusion: Confidence interval does not cross 0 (g falls within the 95th confidence interval). Equation to calculate the 95th confidence interval. Slide 24 Forest Plot Graph showing a forest plot with studies, statistics for each study, and how the study’s Hedges g and the 95th Confidence Interval compares to other included studies. Slide 25 Other Important Statistics Equations described for Variance, Inverse Variance, and Weighted G. The variance is the standard error squared. The inverse variance (w) provides a weight that is proportional to the sample size. Larger samples are more heavily weighted than small samples. Weighted g is the weight (w) times the value of g. It can be + or –, depending on the sign of g. Slide 26Table showing Hedges g, Weights, and Weighted g. Average g (g+) is the sum of the weights divided by the sum of the weighted gs. Slide 27- Selected References Borenstein, M. Hedges, L.V., Higgins, J.P..,& Rothstein, H.R. (2009). Introduction to meta-analysis. Chichester, UK: Wiley. Glass, G. V., McGaw, B., & Smith, M. L. (1981). Meta-analysis in social research. Beverly Hills, CA: Sage. Hedges, L. V., & Olkin, I. (1985). Statistical methods for meta-analysis. Orlando, FL: Academic Press. Hedges, L. V., Shymansky, J. A., & Woodworth, G. (1989). A practical guide to modern methods of meta-analysis. [ERIC Document Reproduction Service No. ED 309 952].
