Ecology Laboratory
advertisement
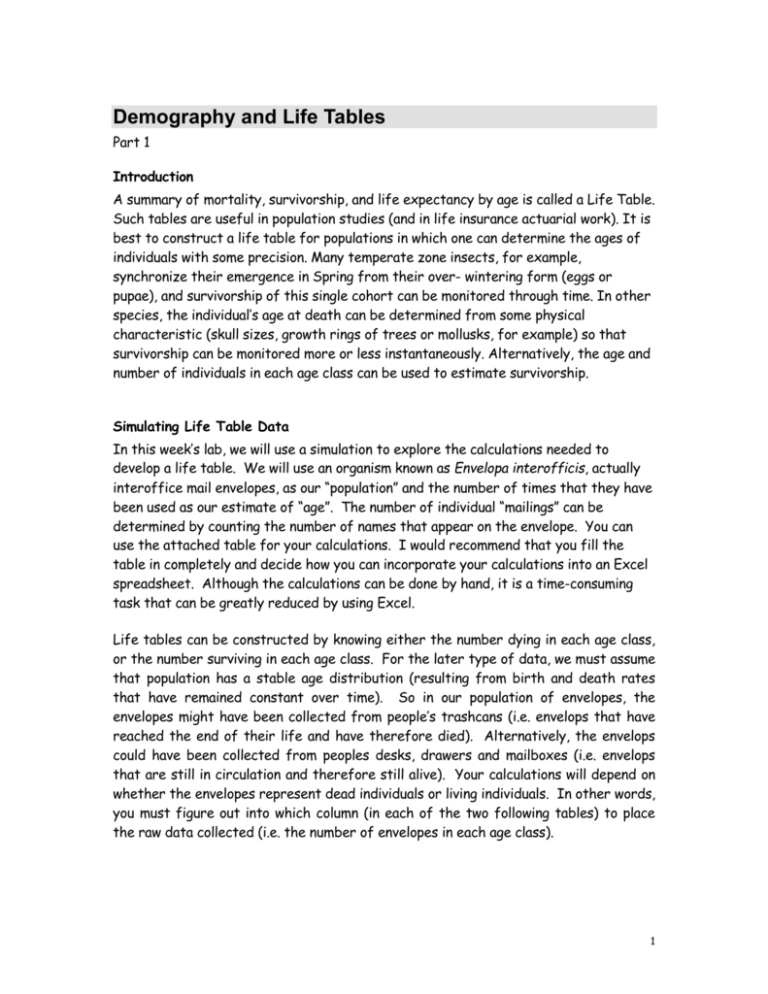
Demography and Life Tables Part 1 Introduction A summary of mortality, survivorship, and life expectancy by age is called a Life Table. Such tables are useful in population studies (and in life insurance actuarial work). It is best to construct a life table for populations in which one can determine the ages of individuals with some precision. Many temperate zone insects, for example, synchronize their emergence in Spring from their over- wintering form (eggs or pupae), and survivorship of this single cohort can be monitored through time. In other species, the individual’s age at death can be determined from some physical characteristic (skull sizes, growth rings of trees or mollusks, for example) so that survivorship can be monitored more or less instantaneously. Alternatively, the age and number of individuals in each age class can be used to estimate survivorship. Simulating Life Table Data In this week’s lab, we will use a simulation to explore the calculations needed to develop a life table. We will use an organism known as Envelopa interofficis, actually interoffice mail envelopes, as our “population” and the number of times that they have been used as our estimate of “age”. The number of individual “mailings” can be determined by counting the number of names that appear on the envelope. You can use the attached table for your calculations. I would recommend that you fill the table in completely and decide how you can incorporate your calculations into an Excel spreadsheet. Although the calculations can be done by hand, it is a time-consuming task that can be greatly reduced by using Excel. Life tables can be constructed by knowing either the number dying in each age class, or the number surviving in each age class. For the later type of data, we must assume that population has a stable age distribution (resulting from birth and death rates that have remained constant over time). So in our population of envelopes, the envelopes might have been collected from people’s trashcans (i.e. envelops that have reached the end of their life and have therefore died). Alternatively, the envelops could have been collected from peoples desks, drawers and mailboxes (i.e. envelops that are still in circulation and therefore still alive). Your calculations will depend on whether the envelopes represent dead individuals or living individuals. In other words, you must figure out into which column (in each of the two following tables) to place the raw data collected (i.e. the number of envelopes in each age class). 1 The terms that appear in the table are defined below. a = the age intervals (or x in the textbook) La = survivors at the beginning of interval a (or nx in the textbook) Da = number that died in interval a qa = mortality rate la = survivorship ea = future life expectancy for individuals reaching age a. The calculations for each of the terms are as follows: La+1 = La - Da Da = La - La+1 1000La = La*(1000/L1) qa = Da / La la = La / L1 ta = (La + La+1)/2 Ta = sum of (ta, ta+1,….ta+n) ea = Ta/La To facilitate your initial data gathering, use the table below: Number of signatures Number of envelopes 0-3 4-6 7-9 10-12 13-15 16-18 19-21 22-24 25-27 28-30 >30 2 Names: Life table for envelops if they represent living individuals: Interval 0-3 4-6 7-9 10-12 13-15 16-18 19-21 22-24 25-27 28-30 >30 a 1 2 3 4 5 6 7 8 9 10 11 La Da 1000La qa la Life table for envelops if they represent dead individuals: Interval 0-3 4-6 7-9 10-12 13-15 16-18 19-21 22-24 25-27 28-30 >30 * You cannot a 1 2 3 4 5 6 7 8 9 10 11 La Da 1000La qa la ta Ta ea * use the equation to determine L1 , but instead must determine it from the number of individuals that have died assuming birth rates and death rates have been constant. Plot two survivorship curves (1000La), one for each set of calculations (based on dead individuals and on living individuals). Note that 1000La based on dead individuals estimates La at the beginning of interval a, so plot the point on the vertical line to the right of that La. The 1000La based on living individuals estimates La at ~mid-interval a, so plot the point between the vertical lines for that La. 3 Envelope Survivorship 1000 Number Surviving 100 10 1 1 2 3 4 5 6 7 8 9 10 11 Age Interval 4 Answer the following questions for the survivorship curve based on dead individuals: How would you describe the survivorship curve of mailing envelopes. In other words, is the proportion of individuals dying over each age interval greater for younger, middle or older age classes, or about the same? What would the survivorship curve you produced tell an office manager about how people in the office decide when to discard envelopes? i.e. Are people using them in the most cost efficient way? How did life expectancy vary with age. What type of pattern in survivorship with age would produce a population where life expectancy (probable length of life from that age on) was shorter for the youngest age classes, then longer for middle age classes. 5 Formulate, based on one of the techniques used this week, a way to construct survivorship curves for pine trees on campus. Unlike our envelope population, recruitment of seed (i.e. births) is essentially a one-time event occurring over a few short years. This means that within an area where the forest is of equal age, all individuals are within the same age class. In your description of your methodology, describe the parameters you will measure and how these will be measured. Also, state and explain any assumption that must be true in order for your estimate of survivorship to be accurate. 6 Demography and Life Tables Part 2 This week turn in a full lab report with the following sections (see “Guidelines for writing a lab report in science” on the lab webpage if you need help): Introduction In your introduction, you must use and cite one source that discusses mortality or survivorship in loblolly pine (Pinus taeda). The literature should discuss possible sources of mortality pine pines, and if there is no discussion of age-specific mortality, speculate on which age classes might be more susceptible to that source of mortality. Your source must be from a refereed scientific journal. You can access journals on-line, but be sure to provide complete citations that include the journal name in the Literature Cited section. You may not use information from sources that are just web pages (i.e. if you find them on-line, they should be actual articles from scientific journals). If you need help on how to search the scientific literature, see “On-line literature searches” on the lab webpage. Do not use any of the papers to be read for final project literature discussion. In the last paragraph of the introduction, formulate and state a hypothesis on the type of survivorship curve that might exist for loblolly pines. This hypothesis should be based on at least one of the articles you cited. Methods Be brief here, but be sure to include time of year and location of the study. Indicate the basic sampling methodology and give some idea of sample size. Results The data will be posted on line. Construct a survivorship curved (use the appropriate calculations from the previous weeks lab). Describe the trend observed in this graph. Discussion Discuss whether or not your data support the hypothesis you stated in the Introduction, and explain why it may have or may not have been supported. Also, discuss the assumptions that you must make for your conclusions to be valid. Literature Cited Your citation should include author(s), date, title of the article, title of the journal, and the volume and page numbers. Use the format in the following example: Bunn SE, DH Edward, NR Loneragan. 1986. Spatial and temporal variation in the macroinvertebrate fauna of streams of the northern jarrah forest. Freshwater Biology 16:67-91. 7 The Relationship Between Size and Age for Pine Trees 90 Age in Years (no. of rings) 80 70 60 50 40 y = 0.4915x R2 = 0.8458 30 20 10 0 0 20 40 60 80 100 120 140 160 180 Circumference of Trunk (cm) 8
