Lab 1: Topographic Maps
advertisement
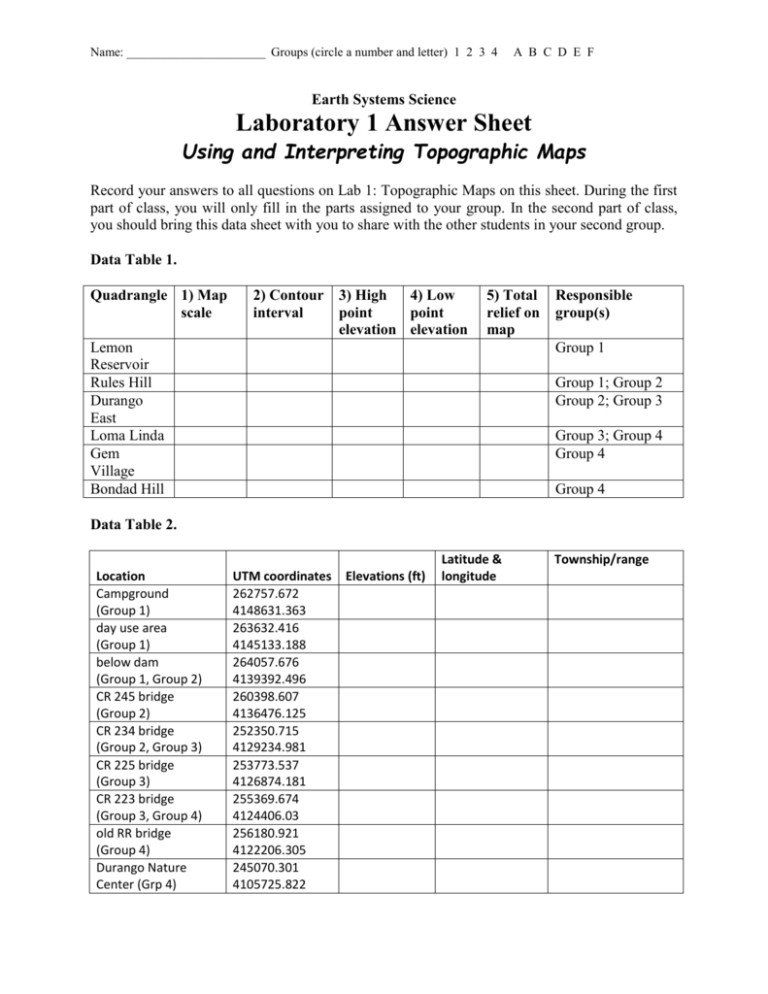
Name: ______________________ Groups (circle a number and letter) 1 2 3 4 A B C D E F Earth Systems Science Laboratory 1 Answer Sheet Using and Interpreting Topographic Maps Record your answers to all questions on Lab 1: Topographic Maps on this sheet. During the first part of class, you will only fill in the parts assigned to your group. In the second part of class, you should bring this data sheet with you to share with the other students in your second group. Data Table 1. Quadrangle 1) Map scale 2) Contour 3) High 4) Low interval point point elevation elevation 5) Total relief on map Lemon Reservoir Rules Hill Durango East Loma Linda Gem Village Bondad Hill Responsible group(s) Group 1 Group 1; Group 2 Group 2; Group 3 Group 3; Group 4 Group 4 Group 4 Data Table 2. Location Campground (Group 1) day use area (Group 1) below dam (Group 1, Group 2) CR 245 bridge (Group 2) CR 234 bridge (Group 2, Group 3) CR 225 bridge (Group 3) CR 223 bridge (Group 3, Group 4) old RR bridge (Group 4) Durango Nature Center (Grp 4) UTM coordinates 262757.672 4148631.363 263632.416 4145133.188 264057.676 4139392.496 260398.607 4136476.125 252350.715 4129234.981 253773.537 4126874.181 255369.674 4124406.03 256180.921 4122206.305 245070.301 4105725.822 Elevations (ft) Latitude & longitude Township/range Name: ______________________ Groups (circle a number and letter) 1 2 3 4 A B C D E F Data Table 3. Stream Segment Segment Relief (ft) Segment Length (feet) Segment Gradient Campground to day use area (Group 1) Day use area to below dam (Group 1) Below dam to CR 245 bridge (Group 2) CR 245 bridge to CR 234 bridge (Group 2) CR 234 bridge to CR 225 bridge (Group 3) CR 225 bridge to CR 223 bridge (Group 3) CR 223 bridge to old RR bridge (Group 4) old RR bridge to Durango Nature Center (Group 4) Part 2 Characteristics of stream segments 2.1) What differences are there between the six quadrangles? Do they have the same scale? Do they have the same contour interval? If there are differences between the scale or the contour interval of the maps, why do you think the maps were made differently from one another? 2.2) Look at the terrain and elevation trends along the length of the Florida River. Which part of the river crosses the steepest terrain? Which part follows the gentlest terrain? 2.3) Look at the shape of the river. How does the shape of the river channel and its valley change along its length? 2.4) Look at your numbers for the river’s gradient. Where does the river have the steepest gradient? Where is its gradient gentlest? Name: ______________________ Groups (circle a number and letter) 1 2 3 4 A B C D E F Longitudinal Profile 3.1) Answer on graph paper. 3.2) Vertical exaggeration Vertical scale: Horizontal scale: Vertical exaggeration = V scale/H scale = Data Table 4: Calculate the distance of each sampling site downstream from the campground. Site Elevation Campground Distance downstream of campground 0 Day use area below dam CR 245 bridge CR 234 bridge CR 225 bridge CR 223 bridge old RR bridge Durango Nature Center Make sure your lab instructor looks at and grades your longitudinal profile. Longitudinal profile grade:______________ 3.5) Which stream segment is steepest? Which has the gentlest slope? 3.6) Look back at your calculations of stream gradient (in the previous section). Do they agree with your longitudinal profile? If not, go back and check your calculations. Predictions List your group’s predictions for water flow, sediment size and amount, and dissolved material here. Explain your predictions to your lab instructor.


