Answers to Homework Chapter 3
advertisement
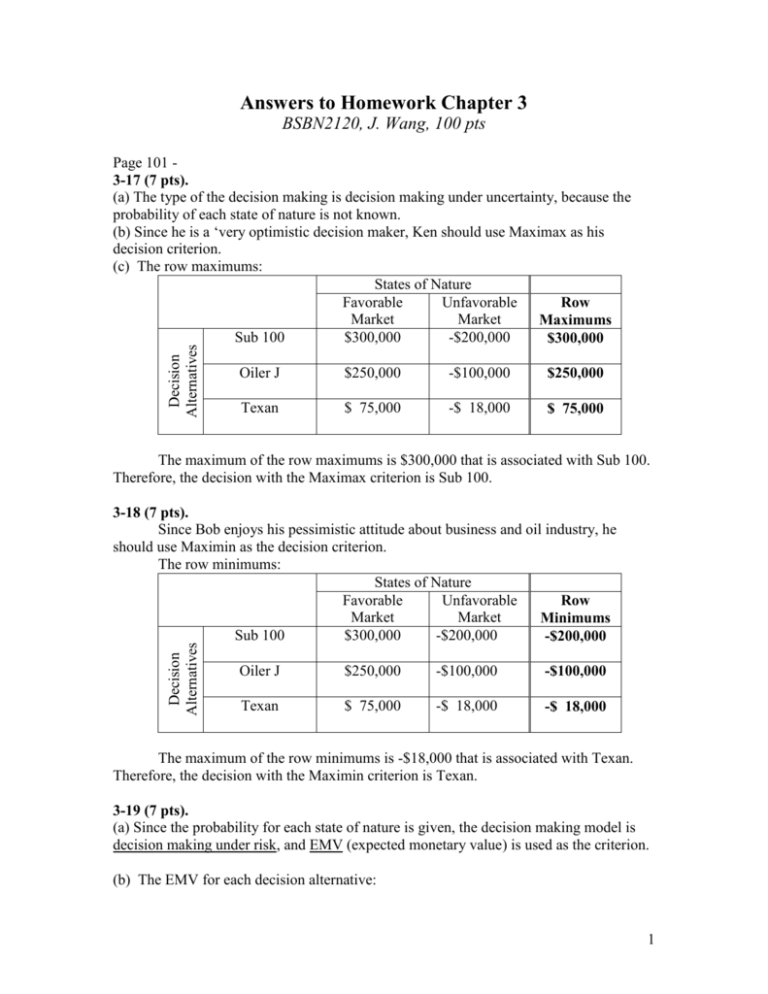
Answers to Homework Chapter 3 BSBN2120, J. Wang, 100 pts Decision Alternatives Page 101 3-17 (7 pts). (a) The type of the decision making is decision making under uncertainty, because the probability of each state of nature is not known. (b) Since he is a ‘very optimistic decision maker, Ken should use Maximax as his decision criterion. (c) The row maximums: States of Nature Favorable Unfavorable Row Market Market Maximums Sub 100 $300,000 -$200,000 $300,000 Oiler J $250,000 -$100,000 $250,000 Texan $ 75,000 -$ 18,000 $ 75,000 The maximum of the row maximums is $300,000 that is associated with Sub 100. Therefore, the decision with the Maximax criterion is Sub 100. Decision Alternatives 3-18 (7 pts). Since Bob enjoys his pessimistic attitude about business and oil industry, he should use Maximin as the decision criterion. The row minimums: States of Nature Favorable Unfavorable Row Market Market Minimums Sub 100 $300,000 -$200,000 -$200,000 Oiler J $250,000 -$100,000 -$100,000 Texan $ 75,000 -$ 18,000 -$ 18,000 The maximum of the row minimums is -$18,000 that is associated with Texan. Therefore, the decision with the Maximin criterion is Texan. 3-19 (7 pts). (a) Since the probability for each state of nature is given, the decision making model is decision making under risk, and EMV (expected monetary value) is used as the criterion. (b) The EMV for each decision alternative: 1 State of Nature Favorable Market Unfavorable Market 0.7 0.3 Sub 100 $300,000 -$200,000 Oiler J $250,000 -$100,000 Texan $ 75,000 -$ 18,000 Alternatives Probability EMV 300,0000.7 + (-200,000)0.3 = 150,000 250,0000.7 + (-100,000)0.3 = 145,000 75,0000.7 + (-18,000)0.3 = 47,100 The highest EMV is $150,000 that is associated with Sub 100. Therefore, the optimal decision is Sub 100. 3-22 (12 pts) (a) Payoff (net gain) Table and EMV’s: Investment Alternatives Stock market CD Probability Good $1,400 $900 0.4 Market Condition Fair $800 $900 0.4 Poor $0 $900 0.2 EMV 880 900 (b) Since 900>880, the best decision is to deposit the money in CD with expected gain of $900. 3-23 (12 pts) (a) The column maximums: Investment Alternatives Good Stock market $1,400 Bank deposit $900 Probability 0.4 Column Max $1,400 Market Condition Fair $800 $900 0.4 $900 Poor $0 $900 0.2 $900 EMV 880 900 $1,100 The expected value with perfect information, EVwPI, is: EVwPI = $1,400*0.4 + $900*0.4 + 900*0.2 = $1,100. The best expected value without the information, EVw/oPI, from the newsletter is $900 as we have calculated in 3-21 (b). That is, EVw/oPI = 900. Therefore, the expected value of perfect information, EVPI, is EVPI = EVwPI - EVw/oPI = $1,100 - $900 = $200. So, Allen would be willing to pay at most $200 for the newsletter. 2 (b) Yes, the annual return rate change would change the amount Allen is willing to pay. The expected value with perfect information is now changing to: EVwPI = $1,100*0.4 + $900*0.4 + 900*0.2 = $980. EMV for alternative “stock market” is: 1,100*0.4+800*0.4+0*0.2=$760. EMV for alternative “bank deposit” is 900*0.4+900*0.4+900*0.2=$900. The max EMV=$900, which is also Vw/oPI. The expected value of perfect information is : EVPI = EVwPI - EVw/oPI = $980 - $900 = $80. So, Allen would be willing to pay at most $80 for a newsletter. 3-24. (11 pts) (a) The given payoff (profit) table, and column maximums. Decision Alternatives States of Nature Strong market Large facility 550,000 Medium facility 300,000 Small facility 200,000 No facility 0 Column maximum 550,000 Fair market 110,000 129,000 100,000 0 129,000 Poor market -310,000 -100,000 -32,000 0 0 The opportunity loss table of the above payoff table: Decision Alternatives States of Nature Large facility Medium facility Small facility No facility Strong market 0 250,000 350,000 550,000 Fair market 19,000 0 29,000 129,000 Poor market 310,000 100,000 32,000 0 (b) The row maximums of the above opportunity loss table: Row Strong market Fair market Poor market Maximum Large facility 0 19,000 310,000 310,000 Medium facility 250,000 0 100,000 250,000 Small facility 350,000 29,000 32,000 350,000 No facility 550,000 129,000 0 550,000 The minimum of the row maximums is 250,000. So, the minimax regret decision is Medium facility. Decision Alternatives States of Nature 3 3-25. (16 pts) Decision: How many cases of BC-6 to order and stock every week. Decision alternatives: Stocking 11 cases, 12 cases, or 13 cases. States of nature: Weekly demand of 11 cases, 12 cases, or 13 cases. Given: Net Profit = $35/case; Cost = $56/case. So, revenue from selling a case is: $35+$56=$91/case sold. Note: There is no penalty cost in terms of ($ out of pocket) for shortage, though there is opportunity cost of shortage due to lost sales. Payoff is in terms of net profit: Profit = $in - $out = Revenue – Cost, that is, Profit = $91*(number of cases sold) - $56*(number of cases ordered/stocked). to order (a) Payoff Table: 11 cases 12 cases 13 cases 11 cases Prob=0.45 91*11-56*11 =385 91*11-56*12 =329 91*11-56*13 =273 Weekly Demand 12 cases Prob=0.35 91*11-56*11 =385 91*12-56*12 =420 91*12-56*13 =364 to order (b) EMV for each decision alternative: Weekly Demand 11 cases 12 cases 13 cases Prob=0.45 Prob=0.35 Prob=0.2 11 cases 12 cases 13 cases 385 329 273 385 420 364 385 420 455 13 cases Prob=0.2 91*11-56*11 =385 91*12-56*12 =420 91*13-56*13 =455 EMV 385*0.45+385*0.35+385*0.3= 385* 329*0.45+420*0.35+420*0.2= 379.05 273*0.45+364*0.35+455*0.2= 341.25 The maximum EMV is 385 that is associated with 11 cases. So, the best decision is stocking 11 cases. to order (c) If the unsold cases can be sold later, then the new payoff table would be: Weekly Demand (States of Nature) 11 cases 12 cases 13 cases Decision Alternatives Prob=0.45 Prob=0.35 Prob=0.2 11 cases 385 385 385 12 cases 420 420 420 13 cases 455 455 455 So, stocking 13 cases is the best alternative. EMV 385 420 455 Or, without needing to generate the above payoff table, it is pretty obvious that stocking 13 cases that is the largest possible weekly demand is the best decision, since there is no penalty of overstocking but there is penalty of under-stocking of losing sales. 4 3-30. (28 pts) (a) Payoff table Decision alternatives Size of 1st Station Small Medium Large Very large (b) Maximax (5 pts) Row maximums: Good Size of 1st Station Market Small $50,000 Medium $80,000 Large $100,000 Very large $300,000 States of Nuture Good Fair Poor Market Market Market $50,000 $20,000 $10,000 $80,000 $30,000 $20,000 $100,000 $30,000 $40,000 $300,000 $25,000 $160,000 Fair Poor Market Market $20,000 $10,000 $30,000 $20,000 $30,000 $40,000 $25,000 $160,000 Row Maximums $50,000 $80,000 $100,000 $300,000 The maximum of the four row maximums is $300,000, and the decision is therefore Very Large. (c) Maximin (5 pts) Row minimums: Size of 1st Station Small Medium Large Very large Good Market $50,000 $80,000 $100,000 $300,000 Fair Poor Market Market $20,000 $10,000 $30,000 $20,000 $30,000 $40,000 $25,000 $160,000 Row Minimums $10,000 $20,000 $40,000 $160,000 The maximum of the four row minimums is $10,000, and the decision is therefore Small. (d) Equally Likely (6 pts) Good Fair Poor Market Market Market Small $50,000 $20,000 $10,000 Medium $80,000 $30,000 $20,000 Large $100,000 $30,000 $40,000 Very large $300,000 $25,000 $160,000 For example, for alternative ‘Small’: Size of 1st Station Averages $20,000 $30,000 $30,000 $55,000 5 Average = ($50,000 + $20,000 + (-$10,000)) / 3 = $60,000 / 3 = $20,000. The maximum of row averages is $55,000, and the decision is therefore Very Large. (e) Realism (Hurwicz), =0.8 (6 pts) Good Fair Poor Hurwicz Market Market Market Values Small $50,000 $20,000 $10,000 $38,000 Medium $80,000 $30,000 $20,000 $60,000 Large $100,000 $30,000 $40,000 $72,000 Very large $300,000 $25,000 $160,000 $208,000 For example, for the row of alternative ‘Small’: Hurvicz value = (row maximum) + (row minimum) (1-) = $50,000 0.8 + (-$10,000) (1-0.8) = $50,000 0.8 + (-$10,000) 0.2 = $40,000 - $2,000 = $38,000. Size of 1st Station The maximum of the row Hurwicz values is $208,000, and the decision is therefore Very Large. (f) and (g). (8 pts) The column maximums: Size of 1st Station Small Medium Large Very large Column Maximum Good Market $50,000 $80,000 $100,000 $300,000 $300,000 Fair Poor Market Market $20,000 $10,000 $30,000 $20,000 $30,000 $40,000 $25,000 $160,000 $30,000 $10,000 The Opportunity Loss (Regret) Table and the row maximum are: Good Fair Poor Row Size of 1st Station Market Market Market Maximums Small $250,000 $10,000 $0 $250,000 Medium $220,000 $0 $10,000 $220,000 Large $200,000 $0 $30,000 $200,000 Very large $0 $5,000 $150,000 $150,000 For examples, the opportunity cost for alternative ‘Small’ in ‘Good market’ is $300,000 $50,000 = $250,000; the opportunity cost for alternative ‘Medium’ in ‘Good 6 market’ is $300,000 $80,000 = $220,000; the opportunity cost for alternative ‘Very large’ in ‘Poor market’ is ($10,000) ($160,000) = $150,000; The minimum of row maximums in the opportunity loss table is $150,000, and the decision therefore is Very Large. 7
