The effect of pH on the reaction between pepsin and egg
advertisement
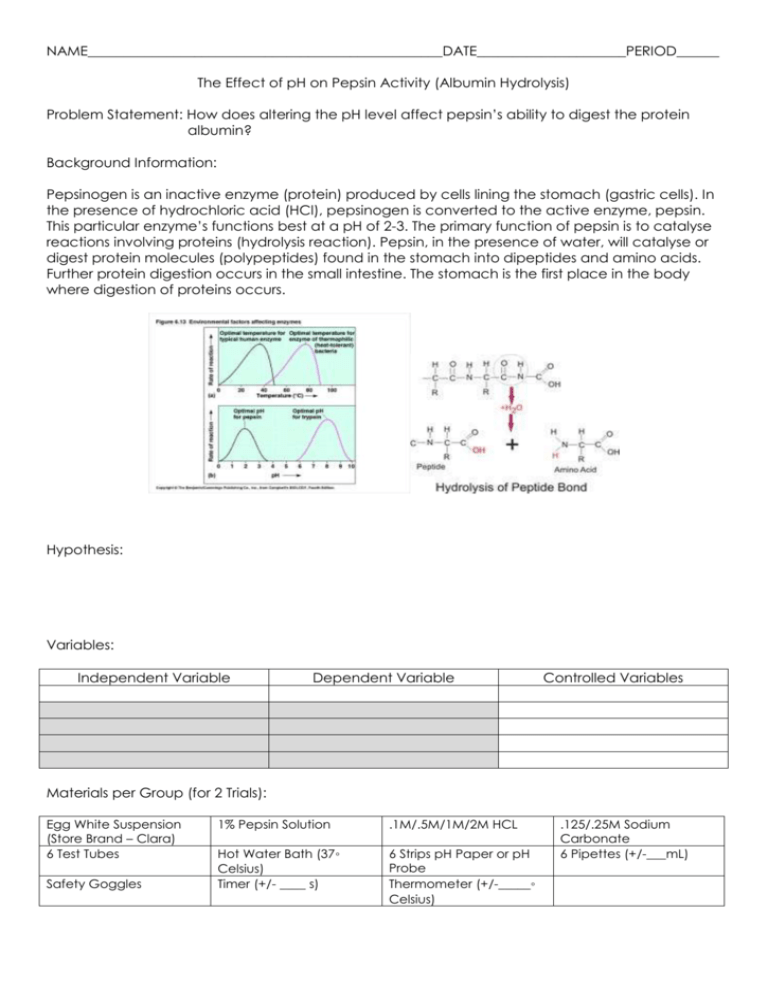
NAME__________________________________________________DATE_____________________PERIOD______ The Effect of pH on Pepsin Activity (Albumin Hydrolysis) Problem Statement: How does altering the pH level affect pepsin’s ability to digest the protein albumin? Background Information: Pepsinogen is an inactive enzyme (protein) produced by cells lining the stomach (gastric cells). In the presence of hydrochloric acid (HCl), pepsinogen is converted to the active enzyme, pepsin. This particular enzyme’s functions best at a pH of 2-3. The primary function of pepsin is to catalyse reactions involving proteins (hydrolysis reaction). Pepsin, in the presence of water, will catalyse or digest protein molecules (polypeptides) found in the stomach into dipeptides and amino acids. Further protein digestion occurs in the small intestine. The stomach is the first place in the body where digestion of proteins occurs. Hypothesis: Variables: Independent Variable Dependent Variable Controlled Variables Materials per Group (for 2 Trials): Egg White Suspension (Store Brand – Clara) 6 Test Tubes Safety Goggles 1% Pepsin Solution .1M/.5M/1M/2M HCL Hot Water Bath (37◦ Celsius) Timer (+/- ____ s) 6 Strips pH Paper or pH Probe Thermometer (+/-_____◦ Celsius) .125/.25M Sodium Carbonate 6 Pipettes (+/-___mL) Procedure: 1. 2. 3. 4. 5. 6. 7. 8. Label six test tubes A1 – A6 or B1-B6 (depending on your group assignment). Each group will be performing 1 trial. Using a graduated pipette, place 5 cm3 of egg-white suspension in each tube. Using a graduated pipette, place 1 cm3 of acid or alkali in each tube using the table below as a guide. Place both sets of test tubes in the water bath (37◦C) BEFORE adding the pepsin. Use a graduated pipette to add 1 cm3 pepsin solution to each tube, and start timing. Time how long it takes for the solution in each tube to become clear. Compare the pH of each tube by taking a sample with a clean dropping pipette and touching the tip of the pipette on to a piece of pH test paper so that a small drop of liquid runs on to it. A calibrated pH probe may also be used. Repeat for each tube, rinsing the pipette between samples. Raw Data: Table 1.0 (Period 2) Tube A1 A2 A3 A4 A5 A6 Egg-white suspension and 1% pepsin +: 2M HCl 1M HCl 0.5M HCl 0.1M HCl 0.25M sodium carbonate 0.125M sodium carbonate Table 2.0 (Period 2) Tube B1 B2 B3 B4 B5 B6 Egg-white suspension and boiled/denatured pepsin +: 2M HCl 1M HCl 0.5M HCl 0.1M HCl 0.25M sodium carbonate 0.125M sodium carbonate Table 3.0 (Period 4) Tube A1 A2 A3 A4 A5 A6 Egg-white suspension and pepsin +: 2M HCl 1M HCl 0.5M HCl 0.1M HCl 0.25M sodium carbonate 0.125M sodium carbonate Table 4.0 (Period 4) Tube B1 B2 B3 B4 B5 B6 Egg-white suspension and boiled/denatured pepsin +: 2M HCl 1M HCl 0.5M HCl 0.1M HCl 0.25M sodium carbonate 0.125M sodium carbonate Qualitative Observations: Sample Calculations: Processed Data Table: Graph(s): Conclusion(s):
