Assessment Statistics for School Year 2002-2003
advertisement
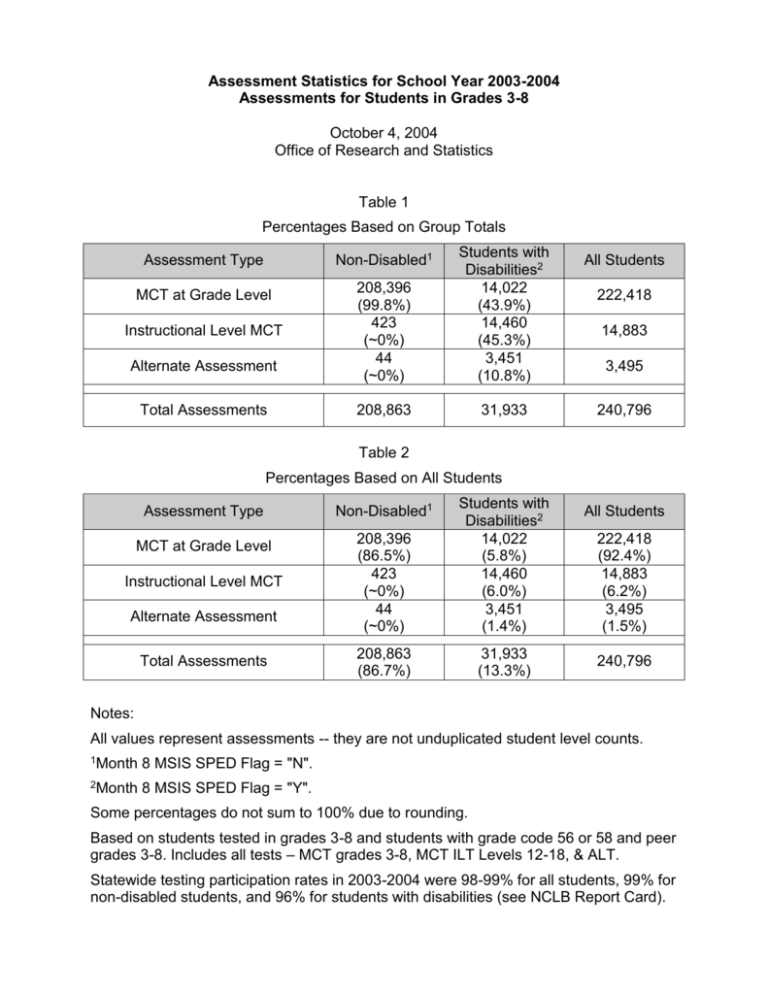
Assessment Statistics for School Year 2003-2004 Assessments for Students in Grades 3-8 October 4, 2004 Office of Research and Statistics Table 1 Percentages Based on Group Totals All Students 208,396 (99.8%) 423 (~0%) 44 (~0%) Students with Disabilities2 14,022 (43.9%) 14,460 (45.3%) 3,451 (10.8%) 208,863 31,933 240,796 Assessment Type Non-Disabled1 MCT at Grade Level Instructional Level MCT Alternate Assessment Total Assessments 222,418 14,883 3,495 Table 2 Percentages Based on All Students All Students 208,396 (86.5%) 423 (~0%) 44 (~0%) Students with Disabilities2 14,022 (5.8%) 14,460 (6.0%) 3,451 (1.4%) 208,863 (86.7%) 31,933 (13.3%) 240,796 Assessment Type Non-Disabled1 MCT at Grade Level Instructional Level MCT Alternate Assessment Total Assessments 222,418 (92.4%) 14,883 (6.2%) 3,495 (1.5%) Notes: All values represent assessments -- they are not unduplicated student level counts. 1Month 8 MSIS SPED Flag = "N". 2Month 8 MSIS SPED Flag = "Y". Some percentages do not sum to 100% due to rounding. Based on students tested in grades 3-8 and students with grade code 56 or 58 and peer grades 3-8. Includes all tests – MCT grades 3-8, MCT ILT Levels 12-18, & ALT. Statewide testing participation rates in 2003-2004 were 98-99% for all students, 99% for non-disabled students, and 96% for students with disabilities (see NCLB Report Card). Table 3 Participation of Students with Disabilities1 By Assessment Mode -- Unduplicated Counts Assessment Mode Grade Level Assessment Only Grade Level and Instructional Level Assessment Grade Level, Instructional Level, and Alternate Assessment Instructional Level Assessment Only Instructional Level and Alternate Assessment Alternate Assessment Only Total Assessed Not Assessed Total Eligible for Assessment2 Number Percentage 10,987 37.3% 2,905 9.9% 39 0.1% 10,886 37.0% 630 2.1% 2,691 9.1% 28,138 95.63 1,292 4.4% 29,430 100.0% Notes: All values represent unduplicated student counts. 1Month 8 MSIS SPED Flag = "Y". Percentages do not sum to exactly 100% due to rounding. Eligible students are students in grades 3-8 and students with grade code 56 or 58 and peer grades 3-8. 3The 2004 statewide testing participation rates for students with disabilities were calculated separately for reading/language and mathematics. In each area, the participation rate was 96% (see NCLB Report Card).
