Supplemental Data Fig. S1 Cell viability and migration of AsPC
advertisement
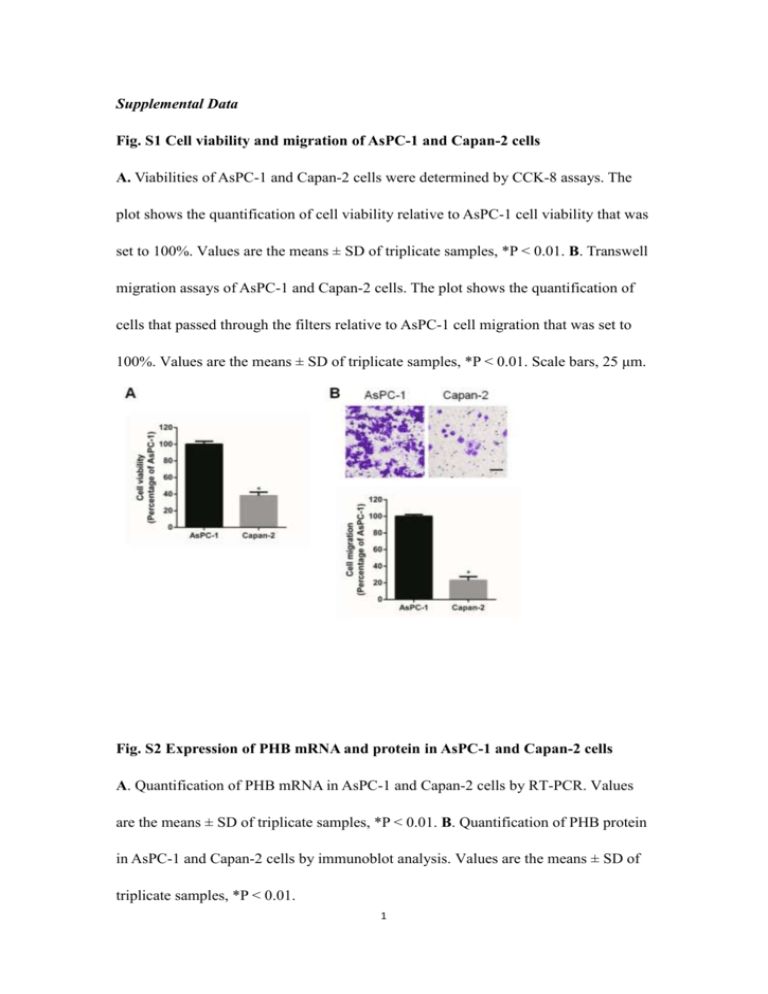
Supplemental Data Fig. S1 Cell viability and migration of AsPC-1 and Capan-2 cells A. Viabilities of AsPC-1 and Capan-2 cells were determined by CCK-8 assays. The plot shows the quantification of cell viability relative to AsPC-1 cell viability that was set to 100%. Values are the means ± SD of triplicate samples, *P < 0.01. B. Transwell migration assays of AsPC-1 and Capan-2 cells. The plot shows the quantification of cells that passed through the filters relative to AsPC-1 cell migration that was set to 100%. Values are the means ± SD of triplicate samples, *P < 0.01. Scale bars, 25 μm. Fig. S2 Expression of PHB mRNA and protein in AsPC-1 and Capan-2 cells A. Quantification of PHB mRNA in AsPC-1 and Capan-2 cells by RT-PCR. Values are the means ± SD of triplicate samples, *P < 0.01. B. Quantification of PHB protein in AsPC-1 and Capan-2 cells by immunoblot analysis. Values are the means ± SD of triplicate samples, *P < 0.01. 1 Fig. S3 Expression of PHB in human normal pancreas and PDAC Quantification of PHB expression in normal pancreas and PDAC tissue. Tumors were blindly scored based on the strength of PHB staining (n=11 normal tissue samples and n=46 PDAC tissue samples. PHB Stain weak moderate Normal 7 (63.6%) 4(36.4%) PDAC 5(10.9%) 14 (30.4%) 2 strong 0 (0%) 27 (58.7%) Fig. S4 Expression of PHB mRNA and protein in siCon- and siPHB-treated pancreatic cancer cells AsPC-1 and Panc-1 cells were transfected with PHB-specific (siPHB) or control (siCon) siRNAs for 48 h. Total mRNA was then collected and analyzed by quantitative real-time PCR. Quantification of PHB mRNA levels in PHB-specific (siPHB)- or control siRNA (siCon)-treated AsPC-1 (A) and Panc-1 (B) cells. Values are the mean ± SD of triplicate samples, *P < 0.01. Fig. S5 Effect of RocA on the proliferation of Capan-2 cells Capan-2 cells were treated with RocA (100 nM) or DMSO for 16 h and then cell viability was determined by CCK-8 assays. Values are the means ± SD of triplicate samples. 3 Fig. S6 Effect of RocA on the survival rate of AsPC-1 cells implanted in the pancreas of the mice AsPC-1 cells (3×10⁶) were orthotopically injected into the pancreas of mice (n=10) as described in method. At 1 week post-implantation, RocA (5.0 mg/kg, n=5) or the vehicle (1% DMSO in olive oil, n=5) was administrated via intraperitoneal injection daily. The survival time of these mice in each group was monitored. A. Survival of mice with established tumor burden randomized to receive RocA or vehicle by intraperitoneal injection. B. Median survival of the mice in (A). Statistical significance was calculated by the log-rank test. Data are shown as the means ± SD. 4
