Lab 16: Earthquakes, Seismicity and Human Risks
advertisement
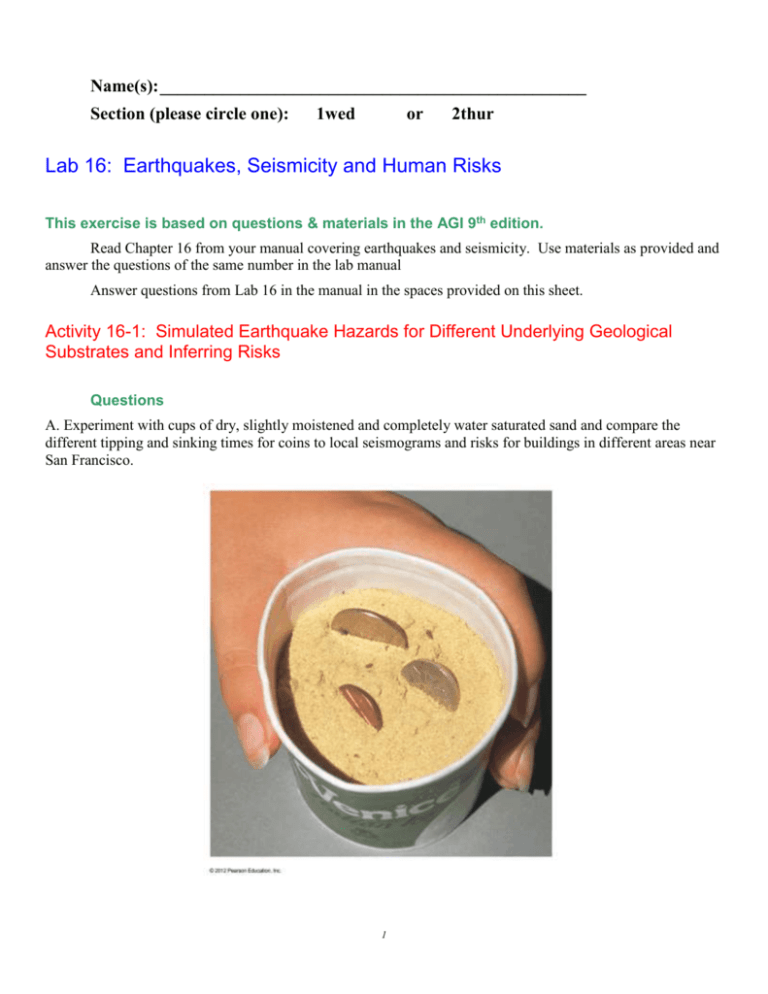
Name(s): ________________________________________________ Section (please circle one): 1wed or 2thur Lab 16: Earthquakes, Seismicity and Human Risks This exercise is based on questions & materials in the AGI 9th edition. Read Chapter 16 from your manual covering earthquakes and seismicity. Use materials as provided and answer the questions of the same number in the lab manual Answer questions from Lab 16 in the manual in the spaces provided on this sheet. Activity 16-1: Simulated Earthquake Hazards for Different Underlying Geological Substrates and Inferring Risks Questions A. Experiment with cups of dry, slightly moistened and completely water saturated sand and compare the different tipping and sinking times for coins to local seismograms and risks for buildings in different areas near San Francisco. 1 Model 1: Uncompacted dry sand plus coins placed vertically in several different directions. See fig 16.1 above. This is your “Lawrence of Arabia Dry Sand Dune” model. The loose uncompacted sand has about 40% porosity filled with air. Note that sand and copper pennies are denser than air. This sand has no cohesion or strength. Think about what it is like to walk uphill in dry sand like this. Tap the cup gently in a vertical direction while slowly rotating the cup counterclockwise. 1. Note how many taps it takes to sink or knock the coins over and describe which direction they fell over. (1) 2. Model 2: Remove the coins and moisten the top of the sand in the cup to make it hold together like sand castle building sand but not soupy. This is your “Sand Castle Model”, the water is enough to wet grain edges and corners, holding them together by surface tension and displacing part of the air to give the dampened sand a bit of strength. Think about how hard it feels on you bare feet to run on damp sand on the beach. Repeat the 1st experiment. Make similar observations and describe them here. (1) 3. Compare your “tip up style construction” coin buildings (think: Costco, Superstore, Canadian Tire…) and how they fared in uncompacted loose fill versus compacted damp sand during identical earthquakes. Which of these two choices is it better to build upon in an earthquake prone area? (1) 4. Model 3: Remove the coins and moisten the sand completely until a thin film of standing water appears. This is your “Quicksand Model”. Think about the Drill Instructor leading his platoon in full combat gear across the Big Muddy. Gently drain the excess millimeter of water on the sand, set this soupy, water saturated sand down gently, then place the coins as before and repeat your Make similar observations as to Models 1 & 2 and describe them here. (1) 5. Think about Models 2 and 3 to interpret the relative hazards of water that moistens and compacts versus complete water saturation. B. San Francisco is in an earthquake prone region. Examine the geological map showing the lithology of the underlying materials and the seismograms corresponding to the Earth’s response in each of those 3 areas to the same earthquake. Keep in mind that in the devastating 1906 earthquake, the greatest damage was in the Marina district where buildings were built on uncompacted artificial fill. Compare the shaking and consider the risk for new apartment buildings in each of the 3 sites, then make your predictions below. 1. The risk at X is: Low High (Circle one and defend your choice). (2) 2. The risk at Y is: Low High (Circle one and defend your choice). (2) 2 3. The risk at Z is: Low High (Circle one and defend your choice). (2) C. October 17, 1989 at 5:04 PDT was the MR = 6.9 Loma Prieta Earthquake which killed 63 people and disrupted game 3 of the World Series. Look at the map for Fig 6.2 for locations and substrate type and fig 6.3 for the seismograms showing different ground amplification at each of these 3 sites. 1. This quake caused no significant damage at point X, moderate damage at point Y and severe damage (you have to demolish the building) at point Z. Explain how these observations compare to your predictions of part B. (3) 2. While the Loma Prieta quake shook the entire San Francisco region yet it had very different effects on buildings as close as 600 m apart. Explain how the differences in underlying substrate materials: uncompacted fill, compacted natural sediment and dense bedrock influence how buildings respond to an earthquake. (3) D. Congratulations, you have just been elected to the SF City Council! Explain what actions might reduce the future earthquake hazards at places like Y & Z. (2) 3 Activity 16-2: How Seismic Waves Travel Through the Earth Questions A. Plot the 1st arrival times of different seismic waves arriving at each of the seismic stations in the table for figure 16.5 following the example for station 1 located at 1800 km epicentral distance, where the main waves arrived at 3.8 minutes, 7.0 minutes & 7.8 minutes. Note that the waves are not random, but occur along 3 discreet trends of time versus distance represented by the bold lines already drawn on the graph. These patterns are the same wherever the stations or earthquakes are on earth. Bullard (1957) first interpreted these patterns. What do you think they mean for the modes of vibration or speeds of travel and pathways through the Earth. (hint: go back and review what is different for each type of body and surface wave as to how it propogates). (3) 4 B. Study the 3 lines (curves) and recall that distance per time = velocity. Here the graph is time per distance, so steeper on the graph actually means slower. Also note that P stands for primary or the first wave to arrive at any distance, S for secondary. On the graph above, label the curves with the type of wave they each represent: P and S for the body waves and L for the surface waves. Explain why the S curve is steeper than the P wave curve. (4) C. Explain why the L arrivals fall on a straight line rather than a curve as for the other 2 types of seismic waves. ( hint: where do each of the waves travel and how do the physical or environmental conditions change as waves traverse the inside of the earth versus near the surface? (2) D.Since the origin (0 time, 0 distance) is the location of the earthquake (focus) and the P and S body waves are not travelling at the same speed, what happens to the S-P arrival time interval as a function of distance? Observe your graph to interpret this and describe how and why it changes like this. (2) E. Imagine an earthquake that “woke up” Houston this morning. The P waves arrived at 6:12.6 AM, and the S waves arrived at 6:17.1 AM. Use these measurements to calculate the S-P arrival time interval and then use figure 16.5 for the travel time curves to answer the following questions. 1. What is the S-P arrival time interval you calculated? Show your work. (2) 2. How far was Houston’s seismic station from the epicenter using your travel time graph? Note you will have to find the vertical interval in time along the edge of the graph and slide this interval over until it matches the time between the P and S curves along a single distance line. Use a piece of scrap paper and 2 pencil marks to do this. (2) 5 3. This epicentral distance you just calculated is the radius of a circle around Houston out to the distance away the earthquake occurred. What other information do you need to precisely locate the epicenter? Explain what you need to know and how you would use this to find the earthquake. (2) Activity 16-3: Locating the Epicenter of an Earthquake Questions A single earthquake was recorded at 3 widely separated stations: Honolulu Hawaii, Sitka Alaska and Charlotte North Carolina. Pick the P and S first arrival times on the 3 seismograms below then answer the following questions. 6 A. Estimate to the nearest tenth of a minute the P & S arrival times. Post them on the table below. Calculate the S-P arrival time interval and post it in the 3rd column. As a check, take a piece of scrap paper and put a tic for the P and S then slide this down to the time axis to measure S-P directly. Your math and measurement should agree to 1 in the last decimal place (tenth of a minute). (9) 1st P arrival (decimal min.) 1st S arrival (decimal min.) S minus P interval (decimal min.) Location Sitka Alaska Charleston North Carolina Honolulu Hawaii B. Use the S-P time intervals you calculate or measure and figure 16.5 you trusty travel-time plot to calculate the epicentral distance for each station and post them on the table below: (3) Location Sitka Alaska Honolulu Hawaii Charlotte North Carolina Latitude/Longitude 57°N, 135°W 35°N, 81°W 21°N, 158°W Epicentral Distance (kilometres) C. Next find the epicenter following the directions below. 1. Use the geographic coordinates (see table above) to mark the 3 seismic stations on the map below. Plot a dot for each one and label them H, S and C for each city. (3) 2. Next, set a compass length equal to the distance for each station to epicenter in turn (use the map scale for this) and scribe 3 perfect circular arcs to find the unique epicenter position where they intersect. Be careful with each step here. If your circles do not find a single point or close to it, go back and check what you measured, calculated and plotted. Finally read the Latitude and Longitude of the epicenter and post it below. (8) North Latitude West Longitude Epicenter 7 D. What is the name of the major crustal fault that occurs in the vicinity of this epicenter? ____________ (1) Activity 16-4: San Andreas Fault at Wallace Creek Questions Below is an oblique aerial photograph of the San Andreas Fault, at Wallace Creek on the Carrizo Plain in Southern California. This fault is a major tectonic boundary between the North America Plate to the East and the Pacific Plate to the west. Observe the offsets in the small streams, the fence line and the fine scale features of the landscape here then answer the following questions: A. This is the North America – Pacific Plate Boundary. 1. Draw in the San Andreas Fault with a fine, exact line to demarcate the plate boundary here. (1) 8 2. Based on the evidence in this photo, add half arrows to each side of the fault showing the directions of relative motion. (1) 3. How far has the recent motion along the San Andreas Fault offset the channels of Wallace Creek? ______(1) 4.From the evidence and your arrows, the San Andreas Fault is a Left Lateral Right Lateral Fault? Circle 1. B. How wide is the San Andreas Fault and Pacific/North America Plate Boundary here? ___________ (1) C. Note the “Dry Valley” in the lower left corner of the photo. Infer how this feature formed and got left out of the drainage system? (2) Activity 16-5: The New Madrid “Blind” Fault Zone The New Madrid Fault Zone is a blind fault which cut underlying Paleozoic and Precambrian Rocks beneath about 1 km of Mesozoic and Cenozoic rocks of the Mississippi Embayment. A series of strong ~MR = 8 magnitude earthquakes occurred here in 1811 and 1812 along the main fault. There are several =5 quakes a year in this region indicating an ongoing hazard. Major faults often occur in conjugate pairs with an alternate plane of faulting occurring at some angle to the main fault as determined by the stresses in the region. 9 Examine figures 16.6 showing how the direction of first motions indicates whether the fault jumped up (pushed towards your station) or pulled away first. If the sign of the first break is positive (above the average line) then the energy was compressional and towards the observer. On the map we’d plot C for compression at this location. If the sign of the first motion was down, the earth pulled away first so the observer feels tension or dilation as the earth moves away or falls. This enables the observer with an array of seismic stations to draw an X separating regions of up versus down or towards versus away for the earthquake’s first arrival. 10 A. On the seismograms above, put a C for Compression (Up/Towards) and a D for Dilation (Down/Away) at each of the 13 seismograms. Now transfer this information to the map below. (13) B. Extend the red line on the main fault to separate the C’s from the D’s and infer how long the fault likely is. Not the trace of the channel of the Mississippi is likely a consequence of some greater breaking and erodability along the fault zone. Now put half arrows on either side of the fault pointing towards the C’s and away from the D’s on opposite sides of the fault. Does this fault seem to have a right lateral or a left lateral sense of strain and motion? _____________________________________________________________________________ (3) C. Look at the pattern of C’s and D’s again. Is there some other fault position and direction of motion that could explain this pattern? (Draw this antithetic fault and put its half arrows on the map. (2) Activity 16-6: Recent Earthquake > MR = 6 :Go to the Natural Resources Canada Earthquake Website: http://earthquakescanada.nrcan.gc.ca/index-eng.php Give Magnitude, date, time, location and damage for the largest Canadian Earthquake in the last year (5) 11


