Thermal Conductivity - University of Manchester
advertisement
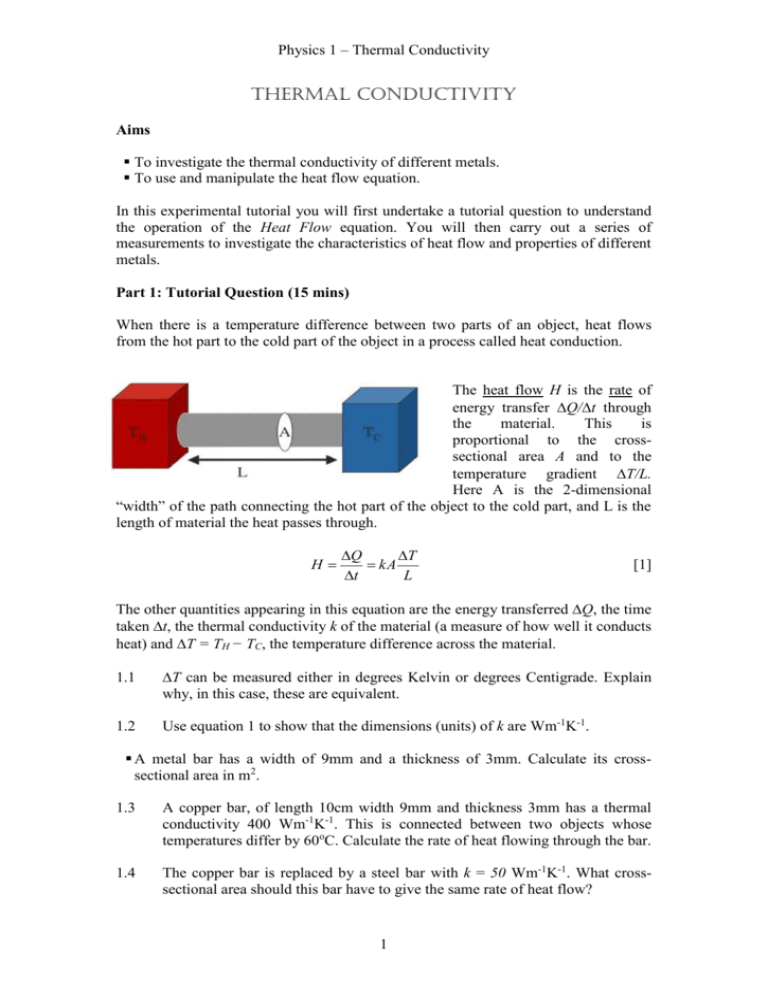
Physics 1 – Thermal Conductivity Thermal Conductivity Aims To investigate the thermal conductivity of different metals. To use and manipulate the heat flow equation. In this experimental tutorial you will first undertake a tutorial question to understand the operation of the Heat Flow equation. You will then carry out a series of measurements to investigate the characteristics of heat flow and properties of different metals. Part 1: Tutorial Question (15 mins) When there is a temperature difference between two parts of an object, heat flows from the hot part to the cold part of the object in a process called heat conduction. The heat flow H is the rate of energy transfer Q/t through the material. This is proportional to the crosssectional area A and to the temperature gradient T/L. Here A is the 2-dimensional “width” of the path connecting the hot part of the object to the cold part, and L is the length of material the heat passes through. H Q T kA t L [1] The other quantities appearing in this equation are the energy transferredQ, the time takent, the thermal conductivity k of the material (a measure of how well it conducts heat) and T = TH − TC, the temperature difference across the material. T can be measured either in degrees Kelvin or degrees Centigrade. Explain why, in this case, these are equivalent. 1.2 Use equation 1 to show that the dimensions (units) of k are Wm-1K-1. A metal bar has a width of 9mm and a thickness of 3mm. Calculate its crosssectional area in m2. 1.3 A copper bar, of length 10cm width 9mm and thickness 3mm has a thermal conductivity 400 Wm-1K-1. This is connected between two objects whose temperatures differ by 60oC. Calculate the rate of heat flowing through the bar. 1.4 The copper bar is replaced by a steel bar with k = 50 Wm-1K-1. What crosssectional area should this bar have to give the same rate of heat flow? 1 Physics 1 – Thermal Conductivity Part 2: Comparison of thermal conductivities of different metals (15 mins) Setup the apparatus as shown in figure 2.1 below. The set of metal bars have temperature sensitive strips attached to their front. As the temperature increases these change from black to cloudy, then to green and finally blue. The most sensitive indication is when the temperature strip changes from black to cloudy. It is harder to judge the change of colour to green and blue. We are going to immerse one end of the bars in hot water and measure how long it takes for heat to reach the far end of the bar. stand Conductivity bars Beaker filled wit hot water As heat is transferred along the bar the Figure 2.1 temperature of successive parts of the bar will rise and the colour of the temperature strip will change. This change in temperature occurs when each part of the bar has absorbed the same amount of energy. A, L and k are all fixed and we will also assume the heat Q required to cause the temperature strip to change colour is a fixed quantity. Measure the width and thickness of the four metal bars and check they have the same cross-sectional area. Use the kettle to boil some water and then pour the hot water into the pyrex beaker until it is roughly half full. Use a thermometer to measure the water temperature to the nearest degree centigrade. You want the temperature of the water to be ~ 70-80 oC, so you may need to add some cold water to bring the temperature down. Take a note of the room temperature as you will need this to determine the temperature difference later. Loosen the correct screw on the clamp stand to lower the metal bars in the beaker of hot water to a depth of around 2cm, ensuring the plastic is not immersed, and tighten the screw. At the same time start the timer and measure the times tcopper(s), taluminuium(s), tbrass(s) and tsteel(s) until the top end of the temperature strips on each of the four bars turn cloudy. 2.1 Rearrange equation [1] to show the dependence of thermal conductivity k on t and predict whether the ends of the copper or steel bars will heat fastest. 2.2 Evaluate 1/t for each bar placed in water with T ~ 50-60oC. This quantity should be proportional to the thermal conductivity of the bar. 2.3 Given that the thermal conductivity of copper is 390 Wm-1K-1, calculate the thermal conductivities of the other three bars. 2 Physics 1 – Thermal Conductivity Part 3: Conductivity of copper (20 mins) Place the metal bars in a bath of cold water and use the digital thermometer to measure the temperature of the water. Again an accuracy of one degree will be sufficient. Boil some more water in the kettle then half fill the beaker as before. By the time the hot water heats the beaker you will find its temperature is somewhere in the range 80-90°C. Anywhere in this range is fine. This should give a temperature difference with the cold water temperature of somewhere around 70°C. Once the temperature sensitive strips have turned black affix them to the clamp stand. Lower the conductivity bars into the beaker so they are immersed ~ 2cm. At the same time start the timer and measure the time it takes until the top end of the temperature strip on the copper bar turns cloudy. Repeat the measurement on the copper bar using temperature differences of around 60°C and 50°C. Firstly, cool the bars by placing them in the cold water bath until the temperature strips turn black again. By the time you have done this the hot water in the beaker will have cooled further. If necessary alter the water temperature by adding small additional amounts of hot or cold water. 3.1 Draw up a table of measurements. For each measurement tabulate the temperature difference T, the time taken t and the product Tt. 3.2 By rearranging equation 1 discuss what trends do you expect the product Tt to show? Do your results agree with this prediction? Part 4: Extension material (optional) 4.1 Here you can gain additional points for successful completion of either (a), (b) or (c). a) Repeat the investigation of how the time taken t for heat to travel along a bar depends on temperature difference T for the brass bar. b) Taking the values of thermal conductivity for copper and brass, together with the time you measured for the whole of the temperature strip on the copper bar to turn cloudy, with a temperature difference T of 60°C, calculate the time for the whole temperature strip on the brass bar to turn cloudy. c) The specific heat capacities of the four metals are given in the table below. Discuss how the differences between the values for the different metals could affect your calculations of thermal conductivities. Metal Specific Heat Capacity (Jkg-1K-1) Copper 385 Aluminium 900 Brass 380 Steel 450 Density Density x Specific (kgm-3) Heat Capacity (JK-1m-3 × 10³) 8900 3426 2700 2430 8500 3230 7900 3555 3 Physics 1 – Thermal Conductivity Further work The following questions are related to the topic covered by this experimental tutorial. Exercise book questions H44-51cover the topic of thermal conductivity. Questions H46, 51 and 50 (harder) are closely related to this work. Mastering Physics questions will be communicated by Miles Padgett m.padgett@physics.gla.ac.uk 4 Physics 1 – Thermal Conductivity Demonstrators' Answers, Hints, Marking Scheme and Equipment List Marking Scheme Section 1.1 1.2 1.3 1.4 2.1 2.2 2.3 3.1 3.2 Discretionary marks TOTAL Mark 0.5 0.5 0.5 0.5 1 1 1 2 1 2 10 Answers Part 1: 1.1 They are equivalent because we are concerned only with the temperature difference. Q L t A T J m W 2 s m K mK k 1.2 0.000027m2 1.3 6.48 Wm-1K-1 1.4 0.000216m2 Part 3: 3.1 t LQ kAT 5 Physics 1 – Thermal Conductivity 1 0.035s 1 t copper 1 3.2 anything that looks similar to: t alu min ium 1 t brass 0.022 s 1 0.011s 1 1 0.005s 1 t steel 3.3 kaluminium = 220 Wm-1K-1 kbrass = 120 Wm-1K-1 ksteel = 50 Wm-1K-1 Part 2: 2.1 anything that looks similar to the following Cold Water Temp (0c) 25 25 25 25 2.2 Hot Water Temp (0c) Temp difference (0c) 77 73 71 67 52 48 46 42 Time (s) 37 39 40 44 Temperature Difference * Time 1924 1872 1840 1848 The product Tt should be a constant. Students can gain optional marks either by performing the first three parts of the exercise extremely well or by successfully carrying out extension material if time permits. In this exercise it is recommended that students look at one of the following three options. A maximum of two optional marks will be available for successful completion of any one of a), b) or c). (b) ~ 100 seconds (c) The value calculated for k for aluminium will be higher than the true value. Equipment List Kettle Pyrex Beaker Cold water basin Thermometer Thermal conductivity bars Timer 6 Physics 1 – Thermal Conductivity 7

