Instructions for the online GC system – hydrogen & oxygen
advertisement
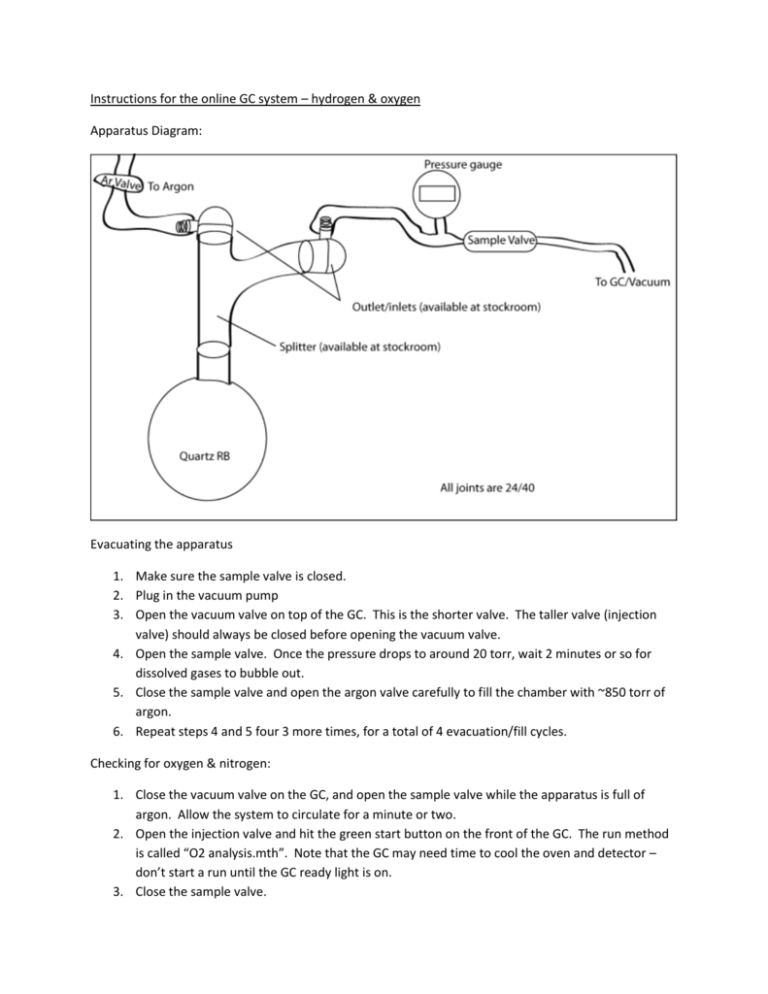
Instructions for the online GC system – hydrogen & oxygen Apparatus Diagram: Evacuating the apparatus 1. Make sure the sample valve is closed. 2. Plug in the vacuum pump 3. Open the vacuum valve on top of the GC. This is the shorter valve. The taller valve (injection valve) should always be closed before opening the vacuum valve. 4. Open the sample valve. Once the pressure drops to around 20 torr, wait 2 minutes or so for dissolved gases to bubble out. 5. Close the sample valve and open the argon valve carefully to fill the chamber with ~850 torr of argon. 6. Repeat steps 4 and 5 four 3 more times, for a total of 4 evacuation/fill cycles. Checking for oxygen & nitrogen: 1. Close the vacuum valve on the GC, and open the sample valve while the apparatus is full of argon. Allow the system to circulate for a minute or two. 2. Open the injection valve and hit the green start button on the front of the GC. The run method is called “O2 analysis.mth”. Note that the GC may need time to cool the oven and detector – don’t start a run until the GC ready light is on. 3. Close the sample valve. 4. When the run has completed, close the injection valve. Plug the vacuum pump in, and open the vacuum valve. This prepares the instrument for the next sample. Obtaining data: 1. Follow the steps above for checking for oxygen & nitrogen, but also write down the pressure that the pressure meter reads when you hit the start button on the GC. This is used in the calculation to find the amount of hydrogen produced. 2. If the software is not already open, click the “Star Toolbar” on the desktop. This will open a toolbar at the top of the screen. Click the leftmost button on the toolbar to open the system control. Analyzing data: 1. In the star toolbar at the top of the screen, click the name of the spectrum just created. It should be in the middle of the toolbar, and it has an icon of two blue peaks. Click view/edit chromatogram from the menu that pops up. 2. Open a different method for analysis – “online H2 O2 calibration.mth” – this method is calibrated for the volumes and detector responses for the observed gases. To do this, click “File”, then “Open Method” 3. After choosing the new method, reintegrate the peaks by clicking “Results” then “Reintegrate Now” 4. View the standard report by clicking “Results”, then choosing the data set you want to view at the bottom of this menu (all open chromatograms show up here), and pick “View Results Only” – results are given in percent, which is calculated by dividing the area counts for the peak by the area counts for the calibration curve. Plug these numbers into the spreadsheet created by Owen Compton to calculate the amount of hydrogen generated.
