Financing Infrastructure - Premier Safety Institute
advertisement
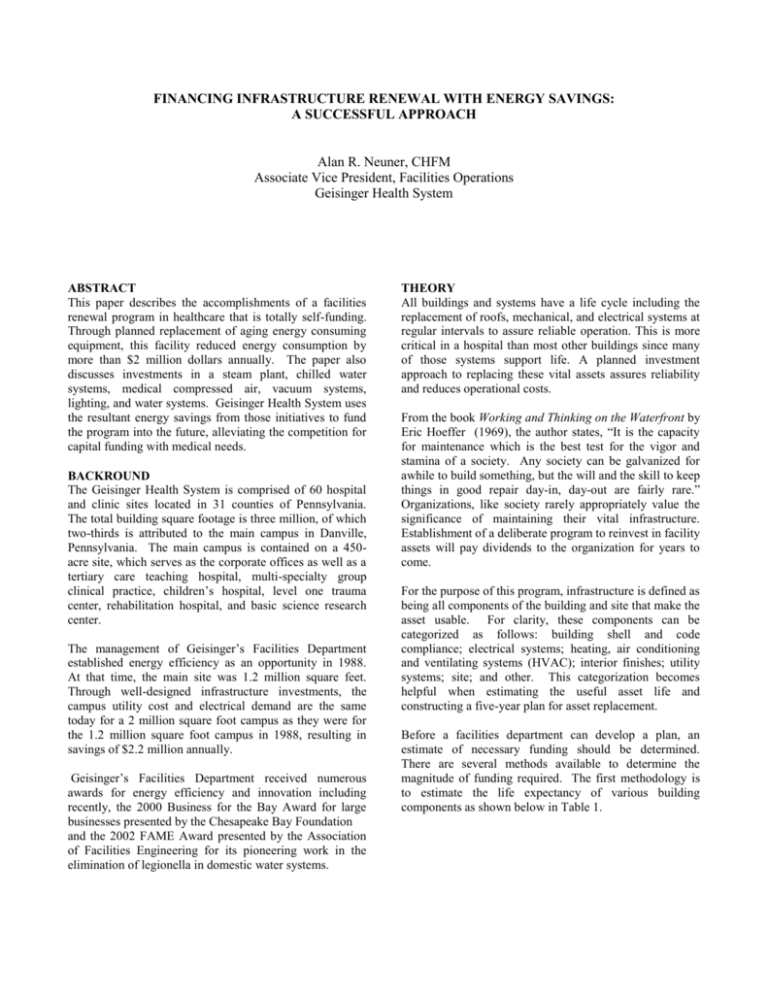
FINANCING INFRASTRUCTURE RENEWAL WITH ENERGY SAVINGS: A SUCCESSFUL APPROACH Alan R. Neuner, CHFM Associate Vice President, Facilities Operations Geisinger Health System ABSTRACT This paper describes the accomplishments of a facilities renewal program in healthcare that is totally self-funding. Through planned replacement of aging energy consuming equipment, this facility reduced energy consumption by more than $2 million dollars annually. The paper also discusses investments in a steam plant, chilled water systems, medical compressed air, vacuum systems, lighting, and water systems. Geisinger Health System uses the resultant energy savings from those initiatives to fund the program into the future, alleviating the competition for capital funding with medical needs. BACKROUND The Geisinger Health System is comprised of 60 hospital and clinic sites located in 31 counties of Pennsylvania. The total building square footage is three million, of which two-thirds is attributed to the main campus in Danville, Pennsylvania. The main campus is contained on a 450acre site, which serves as the corporate offices as well as a tertiary care teaching hospital, multi-specialty group clinical practice, children’s hospital, level one trauma center, rehabilitation hospital, and basic science research center. The management of Geisinger’s Facilities Department established energy efficiency as an opportunity in 1988. At that time, the main site was 1.2 million square feet. Through well-designed infrastructure investments, the campus utility cost and electrical demand are the same today for a 2 million square foot campus as they were for the 1.2 million square foot campus in 1988, resulting in savings of $2.2 million annually. Geisinger’s Facilities Department received numerous awards for energy efficiency and innovation including recently, the 2000 Business for the Bay Award for large businesses presented by the Chesapeake Bay Foundation and the 2002 FAME Award presented by the Association of Facilities Engineering for its pioneering work in the elimination of legionella in domestic water systems. THEORY All buildings and systems have a life cycle including the replacement of roofs, mechanical, and electrical systems at regular intervals to assure reliable operation. This is more critical in a hospital than most other buildings since many of those systems support life. A planned investment approach to replacing these vital assets assures reliability and reduces operational costs. From the book Working and Thinking on the Waterfront by Eric Hoeffer (1969), the author states, “It is the capacity for maintenance which is the best test for the vigor and stamina of a society. Any society can be galvanized for awhile to build something, but the will and the skill to keep things in good repair day-in, day-out are fairly rare.” Organizations, like society rarely appropriately value the significance of maintaining their vital infrastructure. Establishment of a deliberate program to reinvest in facility assets will pay dividends to the organization for years to come. For the purpose of this program, infrastructure is defined as being all components of the building and site that make the asset usable. For clarity, these components can be categorized as follows: building shell and code compliance; electrical systems; heating, air conditioning and ventilating systems (HVAC); interior finishes; utility systems; site; and other. This categorization becomes helpful when estimating the useful asset life and constructing a five-year plan for asset replacement. Before a facilities department can develop a plan, an estimate of necessary funding should be determined. There are several methods available to determine the magnitude of funding required. The first methodology is to estimate the life expectancy of various building components as shown below in Table 1. TABLE 1 – EXPECTED LIFE OF BUILDING COMPONENTS Roofs 20 Years Finishes 10 Years Windows 30 Years Mechanical Systems 30 Years Electrical Systems 30 Years Paving 10 Years Structure 50 Years most important aspect of this funding plan is how the available dollars are invested. A study conducted by Johnson Controls categorized the expenses of building ownership during a 40-year period. Surprisingly, only 11 percent of that expense is for the construction of the building. By far, the largest expense in this study was the operational expenses (maintenance and utilities), which account for 50 percent of the total cost. See Figure 2. Examination of this data yields that the average life of a building component is approximately 25 years. For estimation, this means that 4 percent of the asset value should be budgeted annually to maintain the asset without considering inflation. Using this assumption, 4 percent of the initial cost of the building should be budgeted annually to maintain the infrastructure. Since buildings are typically depreciated over 30 years, 3-1/3 of the 4 percent is already funded for the first 30 years. Cost of Ownership Construction Financing 11% Renovations Operating Expense 14% 50% A somewhat easier method, for some facilities, is to link the infrastructure renewal funding level to square footage, since that is generally a commonly used metric in facilities management. Because of the numerous old buildings within Geisinger Health System, the net book asset value is approximately $300 million for three million square feet, or $100 per square foot (sqft). Conveniently, this works out to $4/sqft for our system. While Geisinger has not yet attained this level of funding, Facilities Operations has been successful in at least structuring annual funding dedicated to infrastructure renewal. Although the analysis indicates a funding level of $4/sqft as appropriate, it was determined that $2 was a more realistic number for Facilities to sell to our operating management as reasonable. Figure 1 depicts Infrastructure Renewal Funding Levels 6000000 25% FIGURE 2 – 40 - YEAR COST OF OWNERSHIP With the disproportionate share of building expenses being energy related, Geisinger invested $8 million of the $20 million funded toward reducing these operating costs. While it would be advantageous to get a return on investment for every dollar spent, that is not possible for items such as interior finishes or paving. Those items have returns based primarily on customer satisfaction and first impressions, which are difficult to quantify in terms of dollars. However, the refurbishment of a unit has caused patient satisfaction scores to increase. The food suddenly tastes better, the nursing care improves, and the entire patient satisfaction score for that unit increases. While not documented, one would believe that this improved patient satisfaction might marginally decrease length of patient stay. 5000000 Dollar s 4000000 3000000 2000000 1000000 0 Goal 1995 1996 1997 1998 1999 2000 2001 2002 2003 Fiscal Year infrastructure-funding levels during the past nine years. FIGURE 1 – FUNDING LEVELS 1995 TO 2002 As seen on the graph, Geisinger has not attained the targeted funding of $2/sqft (far left bar). However, $20 million has been funded during the past nine years. The Once a target funding level is established, the next step is to develop a plan for how to spend the money. When selling this concept to executive management, it’s important to provide some detail of where the money will be spent. The five-year plan can be put together based on rough estimates for categories of expenses, i.e. roofs, paving, utility systems, building shell, code compliance, etc. The actual detailed planning of the specific projects does not need to be completed until after the plan is approved and funded. The plan should be adopted long range, but updated annually. This allows the plan to adapt to changing conditions and priorities. Many times, facilities managers develop detailed plans for infrastructure replacement, and are then never able to get funding. Unless you have time to waste, save the details until after the dollars are in hand. FUNDING Obviously, the most critical piece of the entire process is getting the organization to commit the dollars in a planned fashion for infrastructure renewal. It is intuitive that there needs to be some level of renewal funding, but it is amazing how counter-intuitive some Chief Financial Officers (CFO) can appear to be when faced with limited capital availability and competing demands. While there is no panacea for how to accomplish this task, the following points may be of assistance when dealing with the CFO: Liken infrastructure renewal to home ownership. Most people understand that something needs to be replaced around the house every year. Find out the current annual depreciation expense for the building assets. This is a non-cash expense; meaning money is available for reinvestment. Discuss average age of plant (an accounting calculation) and explain how building new facilities artificially lowers it. The older the buildings you have, the greater this distortion will be. Explain that the building and system assets generally account for about 75 percent of total assets. Discuss the effect building condition has on other aspects of the business, i.e. the affect renovation has on customer satisfaction. Emphasize the downside of a lack of investment. What happens when the chiller fails, the roof leaks, or someone is injured? What would be the magnitude of the resultant business loss or law suits? These points are generally used to convince management of the need to fund an infrastructure renewal program. The argument can be made more convincingly if there is a monetary return from an investment such as energy savings. Identifying the following points will strengthen this argument: Savings in energy go directly to profits. Many businesses focus on new revenue. Taking anticipated savings and dividing it by the desired corporate profit margin can depict the equivalent new revenue. For example: An energy project is expected to save $100,000 per year. If the expected company profit is 5 percent, this yields equivalent new revenue of $2 million per year. Projects that yield savings may be considered for alternative financing, i.e. a performance contract or an operating lease. They can be structured in such a way as to fund the lease payment as well as provide a positive cash flow. Projects with little risk, such as lighting upgrades, should utilize an operating lease, whereas projects with a higher risk of return are best suited for a performance contract. Considering the vulnerability of the investment market. The case can currently be made that infrastructure investments that save energy offer a higher and safer return than the stock market. Hopefully, after following the previous steps, you have convinced your organization to fund the renewal of its assets in a planned and deliberate fashion. Once there is agreement to establish the program, there are several other points that should be considered: Establish a minimum funding level that would be taken off the top of the corporate pot, and not available for other capital needs. The pot is best if set up as a maintenance bank where unspent funds from one year carryover to the next. That way, savings incurred flow back into the pot for funding additional projects. In the future if the pot grows because of carry forwards, a decision can be made to reduce the funding level if necessary. Expect that you will be asked to manage not only commitments, but also cash flow. If you have a pot of dollars available, expect some parameters to be set on how much cash can be spent in any given fiscal year. MEASURING SAVINGS Once a renewal fund and project plan has been established, the next most important step is to document the savings achieved from the energy related projects to demonstrate success and secure future funding. The first rule is to speak in terms management understands: DOLLARS! No one cares about Btu’s, kWh, or kW/ton outside the Facilities team. Calculated savings are fine to help plan the project, but hopefully the project will be significant enough that it is discernable on the utility bill. Ignore maintenance savings when justifying or evaluating savings. Unless staffing dollars are reduced, they do not exist. For some projects, savings calculations are relatively easy. In the case of lighting retrofits, or chiller replacement, it is simply the kW savings times the run hours times the electric rate. For other improvements, it may be beneficial to look at a metric before and after to verify savings. For example, in upgrading boiler efficiency, calculate the cubic feet of gas consumed to produce a pound of steam. After the project is successfully completed, this metric should have decreased, and the savings can be calculated based on the actual steam produced. In general, be conservative in projecting savings before investment, and boastful when they exceed the early projections. CASH OR CREDIT Depending on the type of organization, it may be beneficial to utilize leases or performance contracts. The difference in these financial instruments is that a performance contract will carry with it a guarantee of the projected savings. Realize however, that this guarantee does not come without a cost. The cost is generally in the form of an interest rate that is several points higher to cover the risk of the guarantor. If a project has little or no risk such as lighting upgrades, a simple operating lease would be a more appropriate financing vehicle. Performance contracts are best utilized on complex projects where the savings may be dubious. Building automation control upgrades may be a wise choice for this type of financing arrangement. Obviously the easiest option for the facilities manager is cash, but depending on the organization’s philosophy or financial strength, alternative forms of financing may provide the only viable solution for funding energy conservation projects. ACCOMPLISHMENTS Utilizing these strategies, the Facilities Department at Geisinger has been successful in achieving documented energy savings of $2.2 million annually. These savings can be documented in several ways. Utility actual dollar expenditures are the same today as ten years ago despite campus growth from 1.2 million sqft to 2 million sqft (66 percent) Electrical demand has remained at 8.7 megawatts though this period of growth. Maintenance manning has not increased despite a 66 percent growth; in fact it has decreased because of consolidated and updated systems. Of the $20 million invested in infrastructure during the past nine years, $8 million was invested in energy conserving equipment. Return on Investment (ROI), on energy investments averaged 3.7 years ROI on entire funding of $20 million is 9 years. Infrastructure investment of $2 million annually is now self-funding. Although some of these ROIs may not seem overly attractive, one must consider that these were replacements that had to be completed anyway because of the age of the equipment or other building components. By wisely choosing the replacement systems for maximum efficiency, the success of the program is guaranteed. PROJECTS Table 2 depicts all the energy accomplished, and the respective ROI. related projects TABLE 2 – PROJECT LISTING AND ROI Project 69kv Substation Lighting retrofit Replace absorbers with chillers Electrical distribution upgrade Air handler upgrade Medical air upgrade Boiler Upgrade Incinerator replacement Condensate recovery Tower upgrades Tower control Elevator Upgrades Steam trap monitoring Water side economizers Vacuum system enhancements Domestic water pumps (vfd) Chilled water loop Chilled water vfd pumping Replace underground steam mains Occupancy sensors - lighting Well system upgrades Waste oil heater Building automation upgrades Canopies, foyers, etc Window replacement Instrument air upgrade Blowdown control & condensate monitoring Heat recovery systems Install dealkalizers Total Cost Savings ROI $525,000 $250,000 2.10 $1,800,000 $460,000 3.91 $750,000 $360,000 2.08 $550,000 $50,000 11.00 $400,000 $30,000 13.33 $100,000 $20,000 5.00 $300,000 $300,000 1.00 $300,000 $50,000 6.00 $10,000 $25,000 0.40 $500,000 $50,000 10.00 $20,000 $40,000 0.50 $1,000,000 $45,000 22.22 $50,000 $50,000 1.00 $150,000 $50,000 3.00 $70,000 $10,000 7.00 $100,000 $25,000 4.00 $200,000 $50,000 4.00 $100,000 $50,000 2.00 $250,000 $50,000 5.00 $30,000 $15,000 2.00 $50,000 $20,000 2.50 $3,000 $2,000 1.50 $200,000 $100,000 2.00 $250,000 $10,000 25.00 $200,000 $10,000 20.00 $50,000 $20,000 2.50 $5,000 $30,000 0.17 $75,000 $15,000 5.00 $13,000 $13,000 1.00 $8,051,000 $2,200,000 3.66 Some of the more significant projects accomplished are as follows: 69kV Substation Upgraded service supply from 12.47kV to 69kV to achieve a rate savings from the utility of 10 percent. Project cost $560,000 Savings $250,000 annually Outages reduced 97.5 percent Electrical Distribution Upgrade Replaced entire 12.47kV electrical distribution network and switchgear on a 100-acre campus. Discovered 40 amps of leakage during cable replacement. Project cost $500,000 Savings $50,000 annually Reduced outages 99 percent Lighting Upgrade Upgraded all lighting fixtures (24,000) utilizing T-8 lamps and electronic ballasts utilizing an operating lease as the financial vehicle. Project cost $1.8 million Savings $460,000 annually Reduced electrical demand on substation one megawatt Positive cash flow of $160,000 annually after lease payment (7 years) Replace Absorbers with Electric Chillers The facility was almost exclusively cooled with lowpressure absorbers. The cost to operate the absorbers was $.09/ton. Based on the electrical rate structure and new chiller efficiencies the cost to operate electric chillers is $.03/ton. Investment $750,000 Savings $360,000 annually Cooling Tower Replacement The existing towers were all cross-flow, and designed with a 10 approach to wet bulb. By replacing the towers with 5 approach to wet bulb counter flow towers, fan horsepower and chiller savings were realized. Reducing the condenser water temperature reduces the head on the chiller compressor yielding savings of 2 percent/degree. Counter flow towers also utilize less fan horsepower for the same approach compared to cross-flow towers. Additionally, the towers were converted to an approach to wet bulb control which significantly reduces fan horsepower compared to a single set point. Project cost $500,000 Savings $90,000 annually Waterside Economizers Plate frame exchangers were installed on all chilled water systems to utilize condenser water to cool the chilled water directly when outdoor temperatures are favorable. Investment $150,000 Savings $50,000 annually Reduces 1,400 chiller run hours per year Condensate Recovery Capture the condensate from the majority of air handlers and utilize it as cooling tower make-up. Since this water is pure, significant savings are also realized in the chemical treatment of the condenser water. A spill control pallet is used as a basin to capture the condensate and a small sump pump to pump it into the condenser pump suction. No controls are necessary since the evaporative load of the towers generally coincides with the condensate generated. Cost $500 per air handler Savings $25,000 annually (make-up water and chemical treatment) Compressed Air Upgrade Replaced 25 water ring, reciprocating and screw compressors and associated dryers with two variable frequency drive oil free screw compressors with heat of compression dryers. These dryers are desiccant type and utilize the waste heat from the compressor for regeneration. Additionally, the purge air is recycled, negating the normal 15 percent loss. Eliminating the need for cooling water to the water seal compressors increased system reliability. Investment $100,000 $20,000 annually Vacuum Pumps Replaced water seal vacuum pumps with dry running hook and claw system for improved efficiency and reliability. Investment $70,000 Electrical savings $5,000 annually Water savings $5,000 annually Boiler Upgrade Replaced burners and controls on 34-year-old water tube boilers with gun type burners having direct digital controls and oxygen trim. Investment $300,000 First year savings $300,000 Steam Trap Monitoring Installed a system to monitor the majority of steam traps for flooding and blow-by. Investment $50,000 Savings $50,000 annually CONCLUSION A planned approach to facility infrastructure renewal increases the safety, reliability and appearance of the facility. Judicious investments in energy efficient systems create sufficient cash flow to make the plan self-funding. The key is to understand where the opportunities exist and maximize the return on investment for energy related systems. REFERENCES 1. Financial Planning Guidelines for Facility Renewal and Adaptation, SCUP, 1989 2. Biedenweg, F., Weisburg-Swanson, L., and Gardner, C., Planning for Capital Reinvestment: Alternatives for Facilities Renewal Budgeting, Pacific Partners Consulting Group, 1998. 3. Analysis of Capital Funding for School Facilities, Ontario Ministry of Education and Training, 1996. Alan R. Neuner, CHFM, is Associate Vice President, Facilities Operations for the Geisinger Health System located in central Pennsylvania. He has more than 30 years of facilities management experience in iron and steel production, cryogenics and healthcare. For questions regarding this paper, he can be contacted at (570) 2715515 or e-mail:aneuner@geisinger.edu
