Supplementary Table 2
advertisement
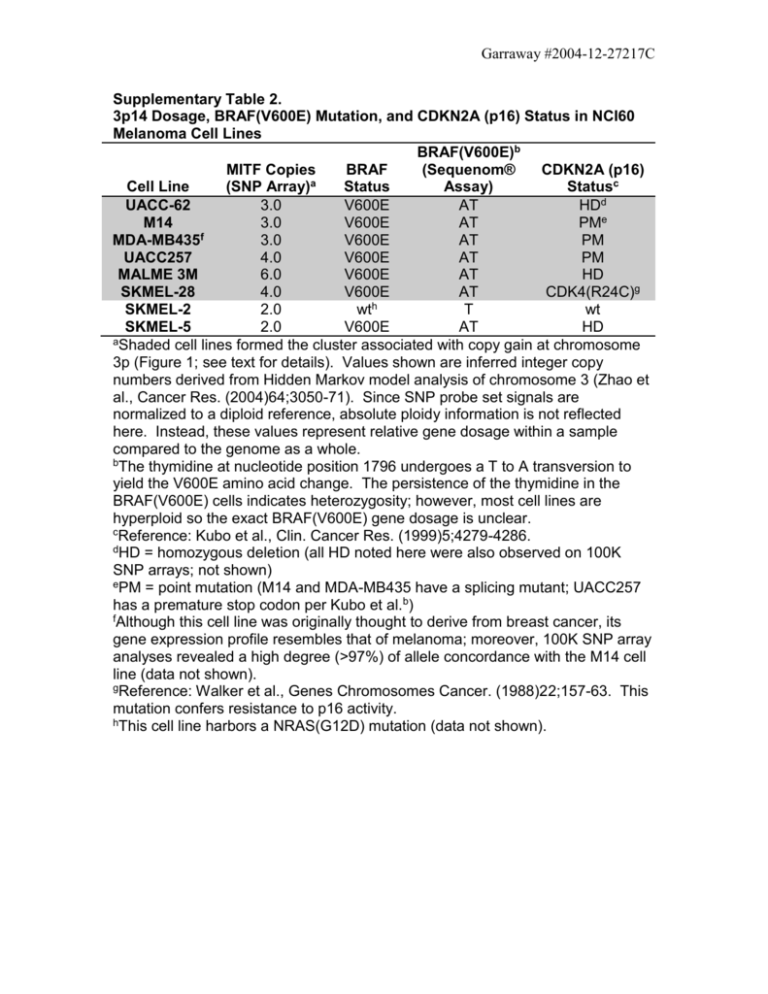
Garraway #2004-12-27217C Supplementary Table 2. 3p14 Dosage, BRAF(V600E) Mutation, and CDKN2A (p16) Status in NCI60 Melanoma Cell Lines BRAF(V600E)b MITF Copies BRAF (Sequenom® CDKN2A (p16) a Cell Line (SNP Array) Status Assay) Statusc UACC-62 3.0 V600E AT HDd M14 3.0 V600E AT PMe f MDA-MB435 3.0 V600E AT PM UACC257 4.0 V600E AT PM MALME 3M 6.0 V600E AT HD SKMEL-28 4.0 V600E AT CDK4(R24C)g h SKMEL-2 2.0 wt T wt SKMEL-5 2.0 V600E AT HD aShaded cell lines formed the cluster associated with copy gain at chromosome 3p (Figure 1; see text for details). Values shown are inferred integer copy numbers derived from Hidden Markov model analysis of chromosome 3 (Zhao et al., Cancer Res. (2004)64;3050-71). Since SNP probe set signals are normalized to a diploid reference, absolute ploidy information is not reflected here. Instead, these values represent relative gene dosage within a sample compared to the genome as a whole. bThe thymidine at nucleotide position 1796 undergoes a T to A transversion to yield the V600E amino acid change. The persistence of the thymidine in the BRAF(V600E) cells indicates heterozygosity; however, most cell lines are hyperploid so the exact BRAF(V600E) gene dosage is unclear. cReference: Kubo et al., Clin. Cancer Res. (1999)5;4279-4286. dHD = homozygous deletion (all HD noted here were also observed on 100K SNP arrays; not shown) ePM = point mutation (M14 and MDA-MB435 have a splicing mutant; UACC257 has a premature stop codon per Kubo et al.b) fAlthough this cell line was originally thought to derive from breast cancer, its gene expression profile resembles that of melanoma; moreover, 100K SNP array analyses revealed a high degree (>97%) of allele concordance with the M14 cell line (data not shown). gReference: Walker et al., Genes Chromosomes Cancer. (1988)22;157-63. This mutation confers resistance to p16 activity. hThis cell line harbors a NRAS(G12D) mutation (data not shown).
