Transforming Graphs of Functions
advertisement
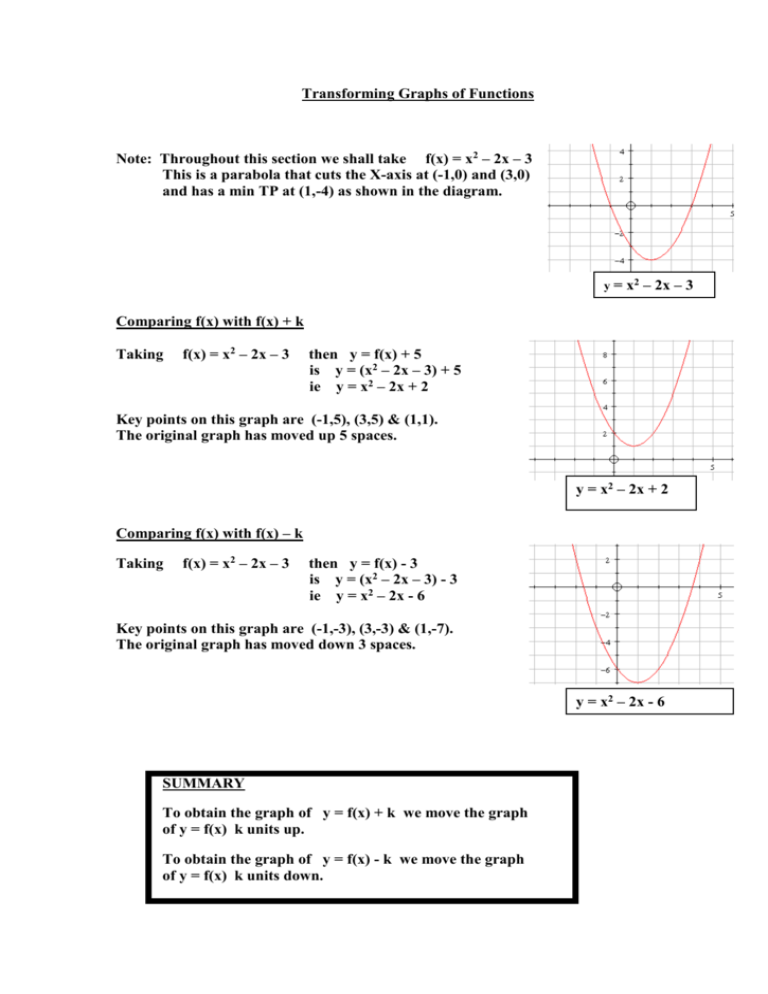
Transforming Graphs of Functions Note: Throughout this section we shall take f(x) = x2 – 2x – 3 This is a parabola that cuts the X-axis at (-1,0) and (3,0) and has a min TP at (1,-4) as shown in the diagram. y = x2 – 2x – 3 Comparing f(x) with f(x) + k Taking f(x) = x2 – 2x – 3 then y = f(x) + 5 is y = (x2 – 2x – 3) + 5 ie y = x2 – 2x + 2 Key points on this graph are (-1,5), (3,5) & (1,1). The original graph has moved up 5 spaces. y = x2 – 2x + 2 Comparing f(x) with f(x) – k Taking f(x) = x2 – 2x – 3 then y = f(x) - 3 is y = (x2 – 2x – 3) - 3 ie y = x2 – 2x - 6 Key points on this graph are (-1,-3), (3,-3) & (1,-7). The original graph has moved down 3 spaces. y = x2 – 2x - 6 SUMMARY To obtain the graph of y = f(x) + k we move the graph of y = f(x) k units up. To obtain the graph of y = f(x) - k we move the graph of y = f(x) k units down. Comparing f(x) with f(x+k) Taking f(x) = x2 – 2x – 3 then y = f(x+3) is y = (x+3)2 – 2(x+3) – 3 is y = x2 + 6x + 9 - 2x - 6 – 3 ie y = x2 + 4x Key points on this graph are (-4,0), (0,0) & (-2,-4). The original graph has moved 3 spaces to the left. y = x2 + 4x Comparing f(x) with f(x-k) Taking f(x) = x2 – 2x – 3 then y = f(x-2) is y = (x - 2)2 – 2(x - 2) – 3 is y = x2 - 4x + 4 – 2x + 4 – 3 ie y = x2 – 6x + 5 Key points on this graph are (1,0), (5,0) & (3,-4). The original graph has moved 2 spaces to the right. y = x2 – 6x + 5 SUMMARY To obtain the graph of y = f(x + k) we move the graph of y = f(x) k units to the left. To obtain the graph of y = f(x – k) we move the graph of y = f(x) k units to the right. Comparing f(x) with -f(x) Taking f(x) = x2 – 2x – 3 then y = -f(x) is y = -(x2 – 2x – 3) ie y = -x2 + 2x + 3 Key points on this graph are (-1,0), (3,0) & (1,4). The original graph has been reflected in the X-axis. y = -x2 + 2x + 3 Comparing f(x) with f(-x) Taking f(x) = x2 – 2x – 3 then y = f(-x) is y = (-x)2 – 2(-x) – 3) ie y = x2 + 2x - 3 Key points on this graph are (-3,0), (1,0) & (-1,-4). The original graph has been reflected in the Y-axis. y = x2 + 2x - 3 SUMMARY To obtain the graph of y = -f(x) we reflect the graph of y = f(x) in the X-axis. To obtain the graph of y = f(-x) we reflect the graph of y = f(x) in the Y-axis. Comparing f(x) with kf(x) Taking f(x) = x2 – 2x – 3 then y = 2f(x) is y = 2(x2 – 2x – 3) ie y = 2x2 – 4x - 6 Key points on this graph are (-1,0), (3,0) & (1,-8). The original graph has moved up “stretched” vertically by a factor of 2. (ie it is twice as tall!) y = 2x2 – 4x - 6 Taking f(x) = x2 – 2x – 3 then y = 0.5f(x) is y = 0.5(x2 – 2x – 3) ie y = 0.5x2 – x - 1.5 Key points on this graph are (-1,0), (3,0) & (1,-2). The original graph has moved up “squashed” vertically by a factor of 2. (ie it is half as tall!) y = 0.5x2 – x - 1.5 SUMMARY To obtain the graph of y = kf(x) (where k > 1) we “stretch” the graph of y = f(x) vertically by a factor of k. To obtain the graph of y = kf(x) (where 0 < k < 1) we “squash” the graph of y = f(x) vertically by a factor of k. Comparing f(x) with f(kx) Taking f(x) = x2 – 2x – 3 then y = f(2x) is y = (2x)2 – 2(2x) – 3 ie y = 4x2 – 4x - 3 Key points on this graph are (-0.5,0), (1.5,0) & (0.5,-4). The original graph has been “squashed” horizontally by a factor of 2. (ie it is half as wide!) y = 4x2 – 4x - 3 Taking f(x) = x2 – 2x – 3 then y = f(0.5x) is y = (0.5x)2 – 2(0.5x) – 3 ie y = 0.25x2 – x - 3 Key points on this graph are (-2,0), (6,0) & (2,-4). The original graph has been “stretched” horizontally by a factor of 2. (ie it is twice as wide!) y = 0.25x2 – x - 3 SUMMARY To obtain the graph of y = f(kx) (where k > 1) we “squash” the graph of y = f(x) horizontally by a factor of k. To obtain the graph of y = f(kx) (where 0 < k < 1) we “stretch” the graph of y = f(x) horizontally by a factor of k.
