An explanation of graphical modifications
advertisement
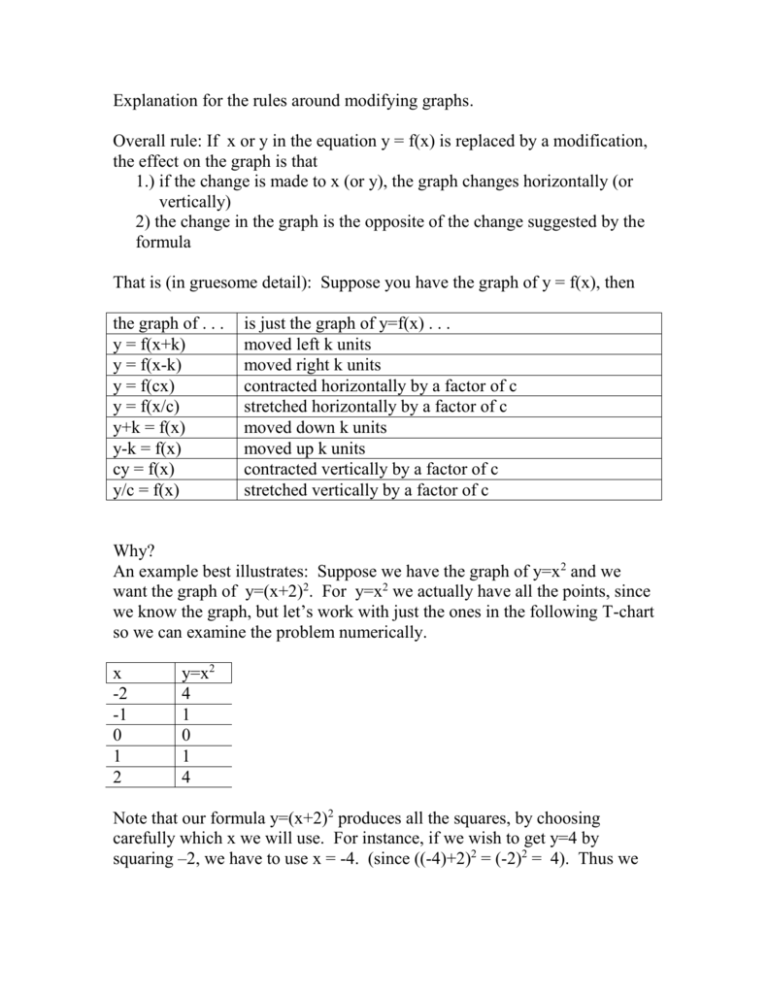
Explanation for the rules around modifying graphs. Overall rule: If x or y in the equation y = f(x) is replaced by a modification, the effect on the graph is that 1.) if the change is made to x (or y), the graph changes horizontally (or vertically) 2) the change in the graph is the opposite of the change suggested by the formula That is (in gruesome detail): Suppose you have the graph of y = f(x), then the graph of . . . y = f(x+k) y = f(x-k) y = f(cx) y = f(x/c) y+k = f(x) y-k = f(x) cy = f(x) y/c = f(x) is just the graph of y=f(x) . . . moved left k units moved right k units contracted horizontally by a factor of c stretched horizontally by a factor of c moved down k units moved up k units contracted vertically by a factor of c stretched vertically by a factor of c Why? An example best illustrates: Suppose we have the graph of y=x2 and we want the graph of y=(x+2)2. For y=x2 we actually have all the points, since we know the graph, but let’s work with just the ones in the following T-chart so we can examine the problem numerically. x -2 -1 0 1 2 y=x2 4 1 0 1 4 Note that our formula y=(x+2)2 produces all the squares, by choosing carefully which x we will use. For instance, if we wish to get y=4 by squaring –2, we have to use x = -4. (since ((-4)+2)2 = (-2)2 = 4). Thus we have (-4,4) in the T-chart for y=(x+2)2. In a similar way, we have the other points in the chart: x -4 -3 -2 -1 0 y=(x+2)2 4 1 0 1 4 Note that each of the new x values is just the old x-value reduced by 2. The reason is that we had to reduce it by 2 in order that, when the formula adds 2, we have the correct input for the squaring function. This argument applies to all x-values in the domain of the original function. The result is that the graph of the new function has exactly the same points as the old function, except that all the x-values are reduced by 2. That is, the entire graph moves 2 units to the left. Note that in this example, the modification was to replace x by x+2. Our rule says that we should modify the graph horizontally and that we should reduce each x by 2 (the opposite of adding 2.) That is exactly what we came up with by working through it step by step, but now we understand why the rule works -- at least for this example. You might be able to see that the reasoning we just did could be modified in predictable ways if 1. we added 7 to x instead of 2. (move 7 units left) 2. we subtracted 3 from x. (move 3 units right) 3. we added 4 to y (move 4 units down) 4. we subtracted .5 units from y (move .5 units up) 5. we multiplied x by 4 (divide each x by 4 – contract horizontally by a factor of 4) 6. we divided each y by 2 (multiply each y by 2 – stretch vertically by a factor of 2) If you don’t understand any of these in ordinary common sense, use the paragraphs on x+2 as a model and see if you can rewrite the argument for the problem you are working. Test yourself by quickly finding the graphs of 1. 2. 3. 4. 5. y = (3x)2 y-8 = x2 y = x-5 (use the new method) y = 7x (use the new method) y/7 = x2 Other variations: 1. Note that you may have to use some of the usual language tricks to do a particular problem a particular way. For instance, if you have the graph of y=f(x) and want to know how far to the right to shift for the graph of y = f(x+2), you know that you actually shift 2 units to the left, but to say it in terms of a shift to the right, you could say shift –2 units to the right. Similarly to stretch by a factor of 1/5 just contract by a factor of 5. 2. You may need to string several of the basic steps together to answer a more complicated question. For instance, if you have the graph of y=f(x) and want the graph of y=f(x/3+7), you could do it in two steps: shift eh graph of f(x) 7 units left to get the graph of y=f(x+7). Next, contract that result by a factor of 3 horizontally to get the graph of y=f(x/3+7). Try these: find the graphs of 1. 2. 3. 4. y = (2x+3)2 y = (2(x+3))2 (y-2)/5 = x2 y/5-2 = x2


![Pre-Calculus Section 2.4 Worksheet [Day 2] Name: Sept 2013](http://s3.studylib.net/store/data/009631193_1-e3d94798b333927b8838d35592e3c417-300x300.png)
