PSYC 466
advertisement
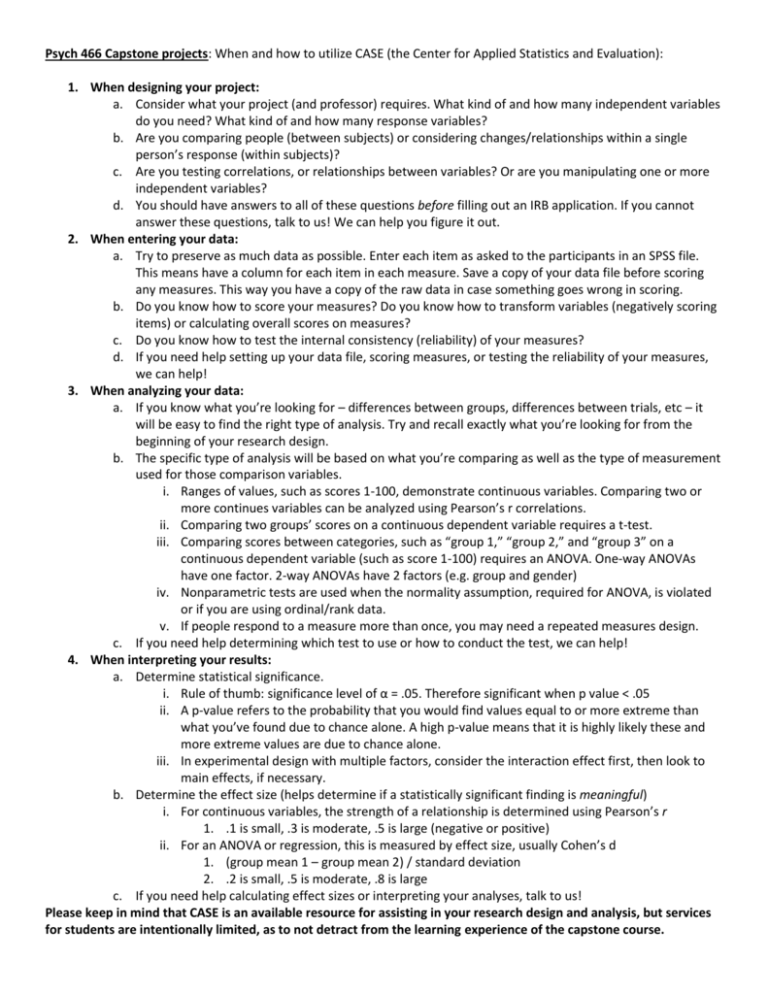
Psych 466 Capstone projects: When and how to utilize CASE (the Center for Applied Statistics and Evaluation): 1. When designing your project: a. Consider what your project (and professor) requires. What kind of and how many independent variables do you need? What kind of and how many response variables? b. Are you comparing people (between subjects) or considering changes/relationships within a single person’s response (within subjects)? c. Are you testing correlations, or relationships between variables? Or are you manipulating one or more independent variables? d. You should have answers to all of these questions before filling out an IRB application. If you cannot answer these questions, talk to us! We can help you figure it out. 2. When entering your data: a. Try to preserve as much data as possible. Enter each item as asked to the participants in an SPSS file. This means have a column for each item in each measure. Save a copy of your data file before scoring any measures. This way you have a copy of the raw data in case something goes wrong in scoring. b. Do you know how to score your measures? Do you know how to transform variables (negatively scoring items) or calculating overall scores on measures? c. Do you know how to test the internal consistency (reliability) of your measures? d. If you need help setting up your data file, scoring measures, or testing the reliability of your measures, we can help! 3. When analyzing your data: a. If you know what you’re looking for – differences between groups, differences between trials, etc – it will be easy to find the right type of analysis. Try and recall exactly what you’re looking for from the beginning of your research design. b. The specific type of analysis will be based on what you’re comparing as well as the type of measurement used for those comparison variables. i. Ranges of values, such as scores 1-100, demonstrate continuous variables. Comparing two or more continues variables can be analyzed using Pearson’s r correlations. ii. Comparing two groups’ scores on a continuous dependent variable requires a t-test. iii. Comparing scores between categories, such as “group 1,” “group 2,” and “group 3” on a continuous dependent variable (such as score 1-100) requires an ANOVA. One-way ANOVAs have one factor. 2-way ANOVAs have 2 factors (e.g. group and gender) iv. Nonparametric tests are used when the normality assumption, required for ANOVA, is violated or if you are using ordinal/rank data. v. If people respond to a measure more than once, you may need a repeated measures design. c. If you need help determining which test to use or how to conduct the test, we can help! 4. When interpreting your results: a. Determine statistical significance. i. Rule of thumb: significance level of α = .05. Therefore significant when p value < .05 ii. A p-value refers to the probability that you would find values equal to or more extreme than what you’ve found due to chance alone. A high p-value means that it is highly likely these and more extreme values are due to chance alone. iii. In experimental design with multiple factors, consider the interaction effect first, then look to main effects, if necessary. b. Determine the effect size (helps determine if a statistically significant finding is meaningful) i. For continuous variables, the strength of a relationship is determined using Pearson’s r 1. .1 is small, .3 is moderate, .5 is large (negative or positive) ii. For an ANOVA or regression, this is measured by effect size, usually Cohen’s d 1. (group mean 1 – group mean 2) / standard deviation 2. .2 is small, .5 is moderate, .8 is large c. If you need help calculating effect sizes or interpreting your analyses, talk to us! Please keep in mind that CASE is an available resource for assisting in your research design and analysis, but services for students are intentionally limited, as to not detract from the learning experience of the capstone course.
