Oneway ANOVA using SAS.
advertisement
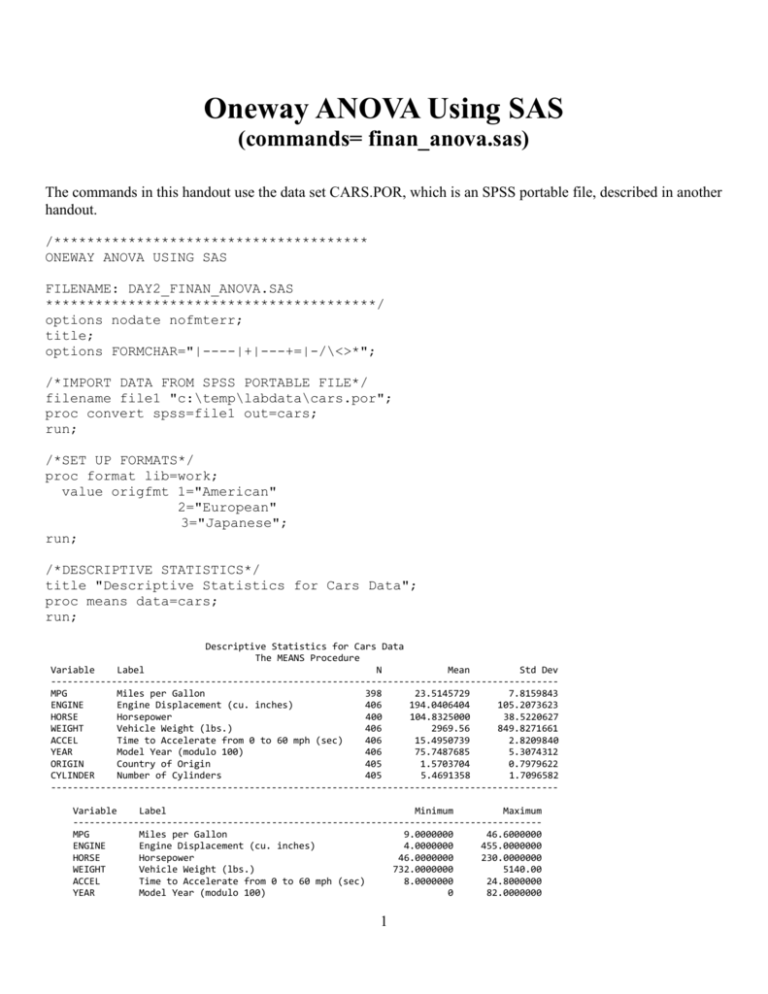
Oneway ANOVA Using SAS (commands= finan_anova.sas) The commands in this handout use the data set CARS.POR, which is an SPSS portable file, described in another handout. /************************************** ONEWAY ANOVA USING SAS FILENAME: DAY2_FINAN_ANOVA.SAS ****************************************/ options nodate nofmterr; title; options FORMCHAR="|----|+|---+=|-/\<>*"; /*IMPORT DATA FROM SPSS PORTABLE FILE*/ filename file1 "c:\temp\labdata\cars.por"; proc convert spss=file1 out=cars; run; /*SET UP FORMATS*/ proc format lib=work; value origfmt 1="American" 2="European" 3="Japanese"; run; /*DESCRIPTIVE STATISTICS*/ title "Descriptive Statistics for Cars Data"; proc means data=cars; run; Descriptive Statistics for Cars Data The MEANS Procedure Variable Label N Mean Std Dev -------------------------------------------------------------------------------------------MPG Miles per Gallon 398 23.5145729 7.8159843 ENGINE Engine Displacement (cu. inches) 406 194.0406404 105.2073623 HORSE Horsepower 400 104.8325000 38.5220627 WEIGHT Vehicle Weight (lbs.) 406 2969.56 849.8271661 ACCEL Time to Accelerate from 0 to 60 mph (sec) 406 15.4950739 2.8209840 YEAR Model Year (modulo 100) 406 75.7487685 5.3074312 ORIGIN Country of Origin 405 1.5703704 0.7979622 CYLINDER Number of Cylinders 405 5.4691358 1.7096582 -------------------------------------------------------------------------------------------Variable Label Minimum Maximum ------------------------------------------------------------------------------------MPG Miles per Gallon 9.0000000 46.6000000 ENGINE Engine Displacement (cu. inches) 4.0000000 455.0000000 HORSE Horsepower 46.0000000 230.0000000 WEIGHT Vehicle Weight (lbs.) 732.0000000 5140.00 ACCEL Time to Accelerate from 0 to 60 mph (sec) 8.0000000 24.8000000 YEAR Model Year (modulo 100) 0 82.0000000 1 ORIGIN Country of Origin 1.0000000 3.0000000 CYLINDER Number of Cylinders 3.0000000 8.0000000 ------------------------------------------------------------------------------------- proc freq data=cars; tables year origin cylinder; format origin origfmt.; run; Descriptive Statistics for Cars Data The FREQ Procedure Model Year (modulo 100) Cumulative Cumulative YEAR Frequency Percent Frequency Percent --------------------------------------------------------0 1 0.25 1 0.25 70 34 8.37 35 8.62 71 29 7.14 64 15.76 72 28 6.90 92 22.66 73 40 9.85 132 32.51 74 27 6.65 159 39.16 75 30 7.39 189 46.55 76 34 8.37 223 54.93 77 28 6.90 251 61.82 78 36 8.87 287 70.69 79 29 7.14 316 77.83 80 29 7.14 345 84.98 81 30 7.39 375 92.36 82 31 7.64 406 100.00 Country of Origin Cumulative Cumulative ORIGIN Frequency Percent Frequency Percent ------------------------------------------------------------American 253 62.47 253 62.47 European 73 18.02 326 80.49 Japanese 79 19.51 405 100.00 Frequency Missing = 1 Number of Cylinders Cumulative Cumulative CYLINDER Frequency Percent Frequency Percent ------------------------------------------------------------3 4 0.99 4 0.99 4 207 51.11 211 52.10 5 3 0.74 214 52.84 6 84 20.74 298 73.58 8 107 26.42 405 100.00 Frequency Missing = 1 /*BOXPLOT OF MPG FOR EACH COUNTRY OF ORIGIN*/ proc sort data=cars; by origin; run; goptions reset=all; goptions device=win target=winprtm; title "MPG by Country"; proc boxplot data=cars; 2 plot mpg * origin / boxstyle=schematic; format origin origfmt.; run; /*CHECK NORMALITY OF MPG FOR EACH COUNTRY*/ proc univariate data=cars normal; class origin; format origin origfmt.; var mpg; histogram/ normal; qqplot / normal(mu=est sigma=est); run; The UNIVARIATE Procedure Fitted Distribution for MPG ORIGIN = American Parameters for Normal Distribution Parameter Symbol Estimate Mean Mu 20.12823 Std Dev Sigma 6.376806 Goodness-of-Fit Test Kolmogorov-Smirnov Cramer-von Mises Anderson-Darling Tests for Normal Distribution ---Statistic--------p Value----D 0.11028609 Pr > D <0.010 W-Sq 0.79702706 Pr > W-Sq <0.005 A-Sq 4.86086867 Pr > A-Sq <0.005 ORIGIN = European Parameters for Normal Distribution Parameter Symbol Estimate Mean Mu 27.89143 Std Dev Sigma 6.72393 Test Goodness-of-Fit Tests for Normal Distribution ---Statistic--------p Value----- 3 Kolmogorov-Smirnov Cramer-von Mises Anderson-Darling D W-Sq A-Sq 0.11075911 0.15737643 1.00050099 Pr > D Pr > W-Sq Pr > A-Sq 0.033 0.020 0.012 ORIGIN = Japanese Parameters for Normal Distribution Parameter Symbol Estimate Mean Mu 30.45063 Std Dev Sigma 6.090048 Goodness-of-Fit Test Kolmogorov-Smirnov Cramer-von Mises Anderson-Darling Tests for Normal Distribution ---Statistic--------p Value----D 0.11821726 Pr > D <0.010 W-Sq 0.11978864 Pr > W-Sq 0.062 A-Sq 0.63047808 Pr > A-Sq 0.098 The graphs below show reasonably symmetric distributions of MPG for each level of ORIGIN. /*ANOVA WITH POST-HOC TESTS */ title "ANOVA Model"; proc glm data=cars; class origin; format origin origfmt.; model mpg = origin; 4 means origin / hovtest=levene(type=abs) welch; means origin / tukey; run; quit; ANOVA Model The GLM Procedure Class Level Information Levels Values 3 American European Japanese Class ORIGIN Number of Observations Read Number of Observations Used Dependent Variable: MPG 406 397 Miles per Gallon Source Model Error Corrected Total Sum of Squares 7984.95725 16056.41474 24041.37199 DF 2 394 396 R-Square 0.332134 Coeff Var 27.10593 Mean Square 3992.47862 40.75232 Root MSE 6.383755 F Value 97.97 Pr > F <.0001 MPG Mean 23.55113 Source ORIGIN DF 2 Type I SS 7984.957245 Mean Square 3992.478623 F Value 97.97 Pr > F <.0001 Source ORIGIN DF 2 Type III SS 7984.957245 Mean Square 3992.478623 F Value 97.97 Pr > F <.0001 Levene's Test for Homogeneity of MPG Variance ANOVA of Absolute Deviations from Group Means Source ORIGIN Error DF 2 394 Source ORIGIN Error Level of ORIGIN American European Japanese Sum of Squares 3.0446 5674.0 Mean Square 1.5223 14.4009 Welch's ANOVA for MPG DF F Value 2.0000 100.52 142.7 N 248 70 79 F Value 0.11 Pr > F 0.8997 Pr > F <.0001 -------------MPG------------Mean Std Dev 20.1282258 6.37680590 27.8914286 6.72392964 30.4506329 6.09004807 Tukey's Studentized Range (HSD) Test for MPG NOTE: This test controls the Type I experimentwise error rate. Alpha 0.05 Error Degrees of Freedom 394 Error Mean Square 40.75232 Critical Value of Studentized Range 3.32709 Comparisons significant at the 0.05 level are indicated by ***. ORIGIN Difference Between Simultaneous 95% 5 Comparison Japanese - European Japanese - American European - Japanese European - American American - Japanese American - European Means 2.5592 10.3224 -2.5592 7.7632 -10.3224 -7.7632 Confidence 0.0940 8.3821 -5.0244 5.7305 -12.2627 -9.7959 Limits 5.0244 12.2627 -0.0940 9.7959 -8.3821 -5.7305 *** *** *** *** *** *** /*NON-PARAMETRIC KRUSKAL-WALLIS TEST REQUEST EXACT P-VALUE USING EXACT STATEMENT*/ title "Non-parametric Comparison"; proc npar1way wilcoxon; class origin; format origin origfmt.; var mpg; exact wilcoxon / mc; run; Non-parametric Comparison The NPAR1WAY Procedure Wilcoxon Scores (Rank Sums) for Variable MPG Classified by Variable ORIGIN Sum of Expected Std Dev Mean ORIGIN N Scores Under H0 Under H0 Score -----------------------------------------------------------------------American 248 36728.50 49352.0 1106.69507 148.098790 European 70 18519.00 13930.0 871.02756 264.557143 Japanese 79 23755.50 15721.0 912.50680 300.702532 Average scores were used for ties. Kruskal-Wallis Test Chi-Square 133.7929 DF 2 Pr > Chi-Square <.0001 Monte Carlo Estimate for the Exact Test Pr >= Chi-Square Estimate 0.0000 99% Lower Conf Limit 0.0000 99% Upper Conf Limit 4.604E-04 Number of Samples Initial Seed 10000 78544000 6
