file - BioMed Central
advertisement
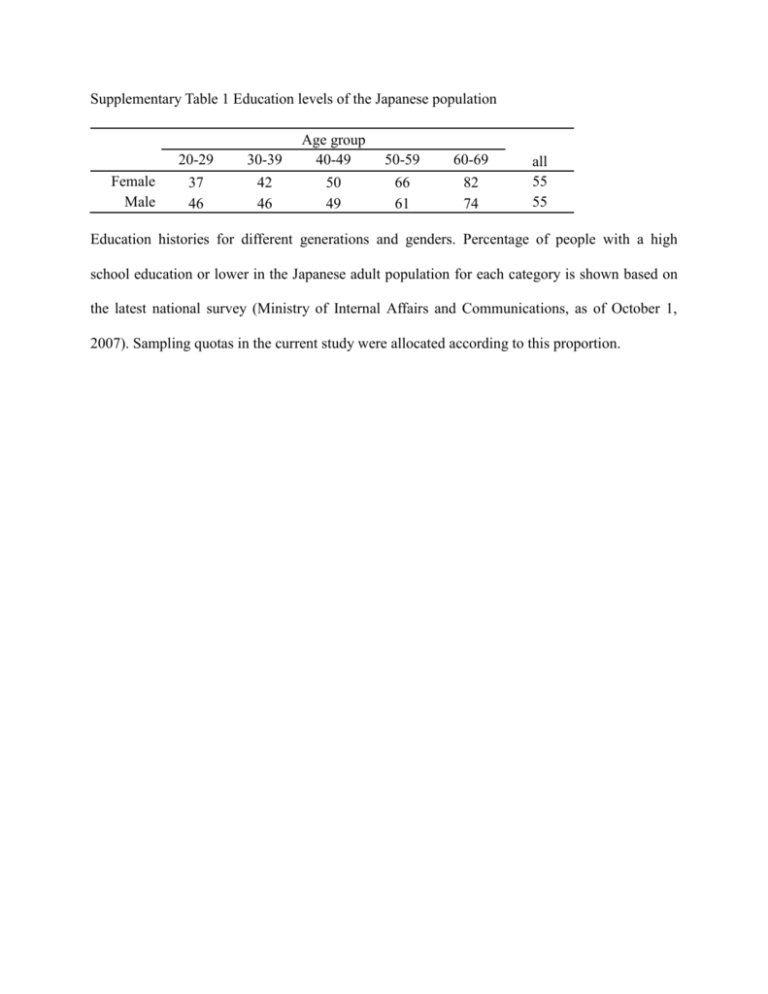
Supplementary Table 1 Education levels of the Japanese population Female Male 20-29 30-39 Age group 40-49 37 46 42 46 50 49 50-59 60-69 66 61 82 74 all 55 55 Education histories for different generations and genders. Percentage of people with a high school education or lower in the Japanese adult population for each category is shown based on the latest national survey (Ministry of Internal Affairs and Communications, as of October 1, 2007). Sampling quotas in the current study were allocated according to this proportion.
