STAT 301 REVIEW FOR TEST 2 – ANSWERES:
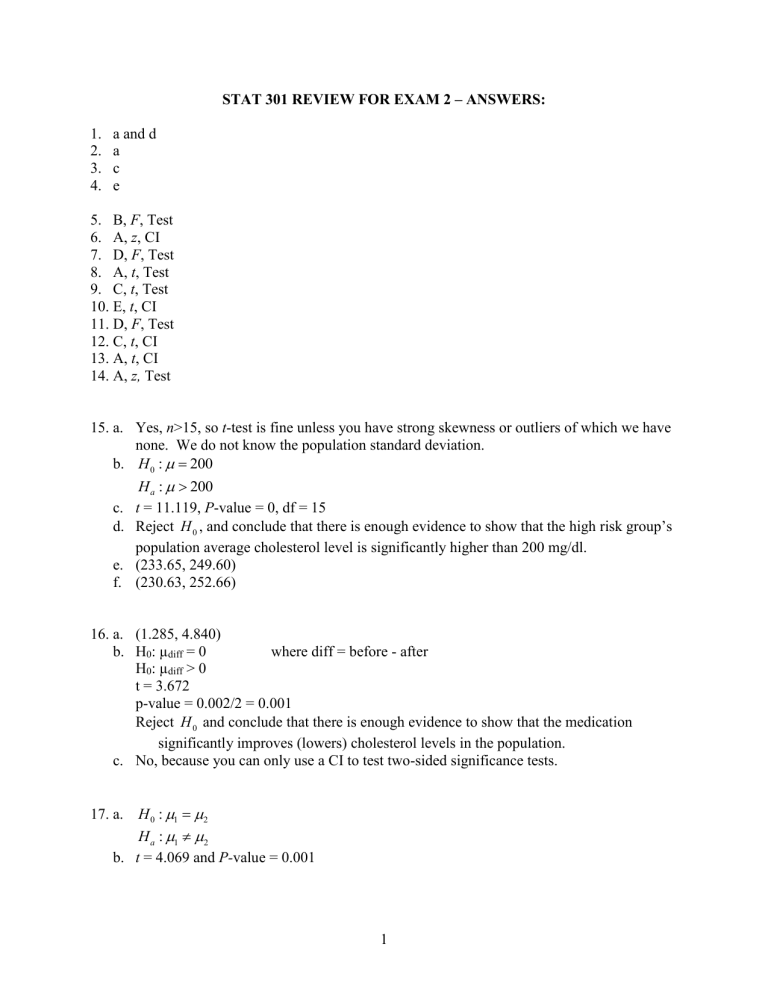
STAT 301 REVIEW FOR EXAM 2 – ANSWERS:
1.
a and d
2.
a
3.
c
4.
e
5.
B, F , Test
6.
A, z , CI
7.
D, F , Test
8.
A, t , Test
9.
C, t , Test
10.
E, t , CI
11.
D, F , Test
12.
C, t , CI
13.
A, t , CI
14.
A, z, Test
15.
a. Yes, n >15, so t -test is fine unless you have strong skewness or outliers of which we have
none. We do not know the population standard deviation. b. H
0
:
200
H a
:
200 c. t = 11.119, P -value = 0, df = 15 d. Reject H , and conclude that there is enough evidence to show that the high risk group’s
0 population average cholesterol level is significantly higher than 200 mg/dl. e. (233.65, 249.60) f. (230.63, 252.66)
16.
a. (1.285, 4.840) b.
H
0
: µ diff
= 0
H
0
: µ diff
> 0 t = 3.672 where diff = before - after p-value = 0.002/2 = 0.001
Reject H and conclude that there is enough evidence to show that the medication
0 significantly improves (lowers) cholesterol levels in the population. c.
No, because you can only use a CI to test two-sided significance tests.
17.
a. H
0
H a
:
:
1
2
1
2 b.
t = 4.069 and Pvalue = 0.001
1
c.
Reject H , there is enough evidence to conclude that there is a significant difference in
0 the population average weights of the combs of roosters fed two different vitamin supplement diets. d.
(9.25955, 56.02616)
18.
a. Matched pairs. b. H
0
:
0 versus H a
:
µ y
= µ x
.)
c. t = 2.378 d. t
x s
D
D
0 n
.85
1.5852 / 20 e. 0.014
0 (Also ok to use µ diff
with diff = y – x, but not ok to use f. Reject H , there is enough evidence to show that the new breakfast drink tastes
0 significantly better than the old breakfast drink on average in the population.
19.
a. H
0
H
0
:
10.6
:
10.6
b.
Z = 2.00 c.
Pvalue = .0228 d.
Fail to reject H
0
at alpha = 0.01 level. There is not enough evidence to show that the new fertilizer produces a population mean yield significantly above 10.6 bushels/acre. e.
Picture.
20. a. (59.21, 64.37)
b. 2.578
c. H
0
:
61.3
H a
:
61.3
Since 61.3 is in the confidence interval, you fail to reject H and conclude that there is
0
not enough evidence to show that the population mean weight of male runners is
significantly different from 61.3.
21. a. There is a significant difference between the distance the 2005 titanium and
the other two drivers can hit. b. (7.689)2 > 10.799, so yes. c. 9.71 d. 0.7256 e. H
0
:
1
2
3
H a
: at least one
is different i
F = 43.626, P -value = 0
2
Reject H , at least one driver has a different population mean from the others.
0 f. No, you need Bonferroni’s procedure. Bonferroni’s procedure found a
significant difference between the 2005 titanium and the other two drivers. The steel and
the persimmon drivers are not significantly different.
22.
a. The driver type affects distance since none of the lines are horizontal; the ball
type affects distance since all of the lines are not on top of each other; and the
interaction is significant since the lines are not parallel. b. The main effects of driver and ball are significant and interaction is significant to
population mean drive distance.
23.
C
24.
B
25.
D
26.
D
27.
B
28.
A
29.
D
30.
a. (2) b. (4) c. (2)
31.
C
32.
C
33.
Picture with 2 tails shaded with the total representing the P-value, lines drawn at t = -3.138 and t = +3.138.
34.
D
35.
E
36.
Picture with line drawn at t = +3.138, whole curve to the left of this line is shaded, representing the P-value.
37.
B
38.
D, 2 independent groups with 1 quantitative variable
39.
C, 1 sample with everybody tested twice (before and after)
40.
A, 1 quantitative variable from 1 sample, population standard deviation known
41.
B, 1 quantitative variable from 1 sample, population standard deviation unknown
42.
E, more than 2 independent groups (divided up one way, by race), 1 quantitative measurement
43.
F, 2 categorical ways of dividing up the subjects (race and weight gain), 1 quantitative measurement.
3


