Solution_HW9
advertisement
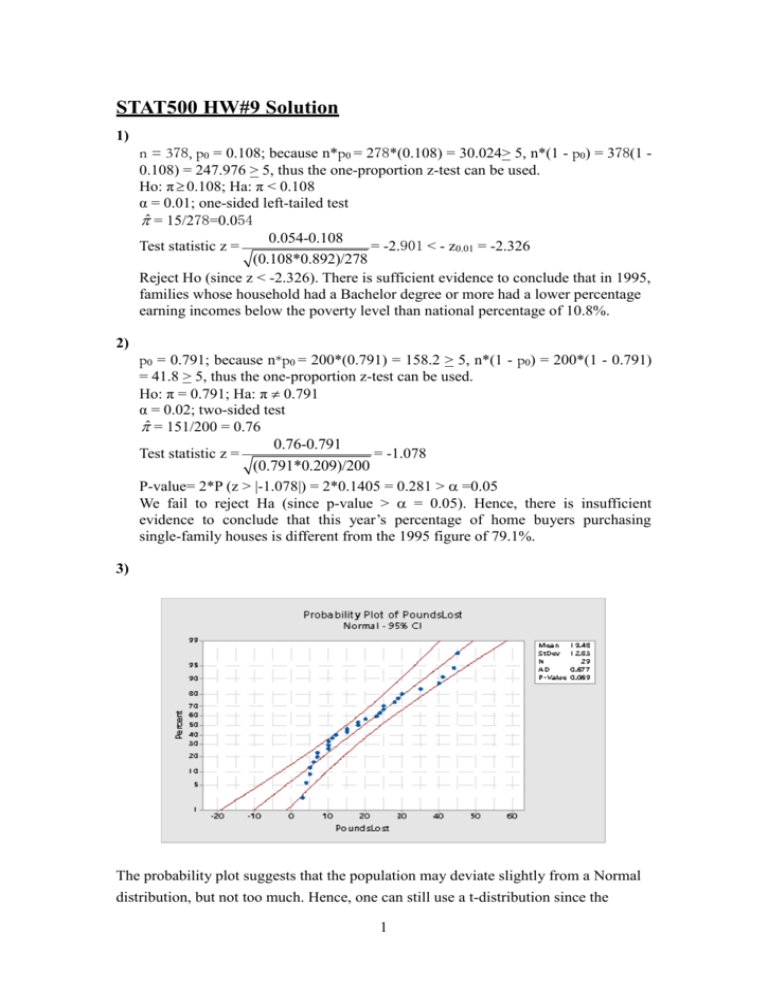
STAT500 HW#9 Solution 1) n = 378, p0 = 0.108; because n*p0 = 278*(0.108) = 30.024> 5, n*(1 - p0) = 378(1 0.108) = 247.976 > 5, thus the one-proportion z-test can be used. Ho: π 0.108; Ha: π < 0.108 α = 0.01; one-sided left-tailed test ˆ = 15/278=0.054 0.054-0.108 Test statistic z = = -2.901 < - z0.01 = -2.326 (0.108*0.892)/278 Reject Ho (since z < -2.326). There is sufficient evidence to conclude that in 1995, families whose household had a Bachelor degree or more had a lower percentage earning incomes below the poverty level than national percentage of 10.8%. 2) p0 = 0.791; because n*p0 = 200*(0.791) = 158.2 > 5, n*(1 - p0) = 200*(1 - 0.791) = 41.8 > 5, thus the one-proportion z-test can be used. Ho: π = 0.791; Ha: π 0.791 α = 0.02; two-sided test ˆ = 151/200 = 0.76 0.76-0.791 Test statistic z = = -1.078 (0.791*0.209)/200 P-value= 2*P (z > |-1.078|) = 2*0.1405 = 0.281 > =0.05 We fail to reject Ha (since p-value > = 0.05). Hence, there is insufficient evidence to conclude that this year’s percentage of home buyers purchasing single-family houses is different from the 1995 figure of 79.1%. 3) The probability plot suggests that the population may deviate slightly from a Normal distribution, but not too much. Hence, one can still use a t-distribution since the 1 sample size is 29, not far from 30. Note that we cannot reject the null which is observed values are normally distributed since p-value (=0.069) is larger than 0.05. Note that even though the alpha level set for the testing mean problem is at α = 0.01, the alpha level we need to compare to is the default 0.05. Since here we are checking whether the sample may come from a normal distribution. The alpha level is not impacted by the alpha level set for testing mean problem. Ho: µ ≥ 30 vs. Ha: µ< 30 The Minitab output is summarized in the table below. Since p-value = 0.000 < α = 0.01, the data provides sufficient evidence to reject the null hypothesis. Therefore, we should conclude that the mean value of the amount of weight lost in a program during six months should be less than 30 pounds. One-Sample T: PoundsLost Test of μ = 30 vs < 30 99% Upper Variable N Mean PoundsLost 29 19.48 StDev SE Mean 12.83 Bound 2.38 25.36 T P -4.41 0.000 4) (Note: it is also okay to use z table to compute the p-value since n=33) Ho: µ> 20 vs. Ha: µ<20 y 0 16.2 20 t - 2.695 s/ n 8.1 / 33 The rejection region for this test would be a t-value less than t0.05, df=32=-1.69. Since the calculated t-value is -2.695, we reject the null hypothesis, and thus there is sufficient data to conclude that the population of US commercial jets has a mean age less than 20 years. 5) (Note: it is NOT okay to use z table since n=26) Ho: µ= 29 vs. Ha: µ≠29; two-tailed test, α=0.02, t= y - u0 33.02-29 = = 2.512 s / n 8.16/ 26 2 Since t0.02/2, df=25 = 2.485. The rejection region for this problem would be |t| > t0.02/2,df=25 = 2.485. Since the observed t-value is 2.512, we reject Ho. We conclude that there is sufficient evidence to doubt the supervisor’s claim. 6) (Note: it is also okay to use z table to compute the p-value since n=30) With n=30, there is no need to check the probability plot since large sample size implies that we can use the one sample t-test. Ho: µ= 675 vs. Ha: µ > 675; two-tailed test y - m 712.0-675 = t= = 2.35 > t0.05,29=1.699 (rejection region) s / n 86.4 / 30 P-value= P (t > 2.35) =0.0123< α = 0.05.Therefore we can reject Ho and conclude Ha. Minitab output to verify above by hand calculations: One-Sample T: Voters Test of μ = 675 vs > 675 Variable Voters N Mean StDev SE Mean 95% Lower Bound 30 712.0 86.4 15.8 685.2 7) Ho: =48 Ha: m > 48 Difference = 1 α = 0.01, s = 1.5, Power = 80% Power and Sample Size 1-Sample t Test Testing mean = null (versus > null) Calculating power for mean = null + difference α = 0.01 Assumed standard deviation = 1.5 Sample Target Difference 1 Size Power Actual Power 26 0.8 0.812333 Thus, 26 bottles of detergent are needed. 3 T 2.35 P 0.013


