Practice Test 2 – Answer Key
advertisement
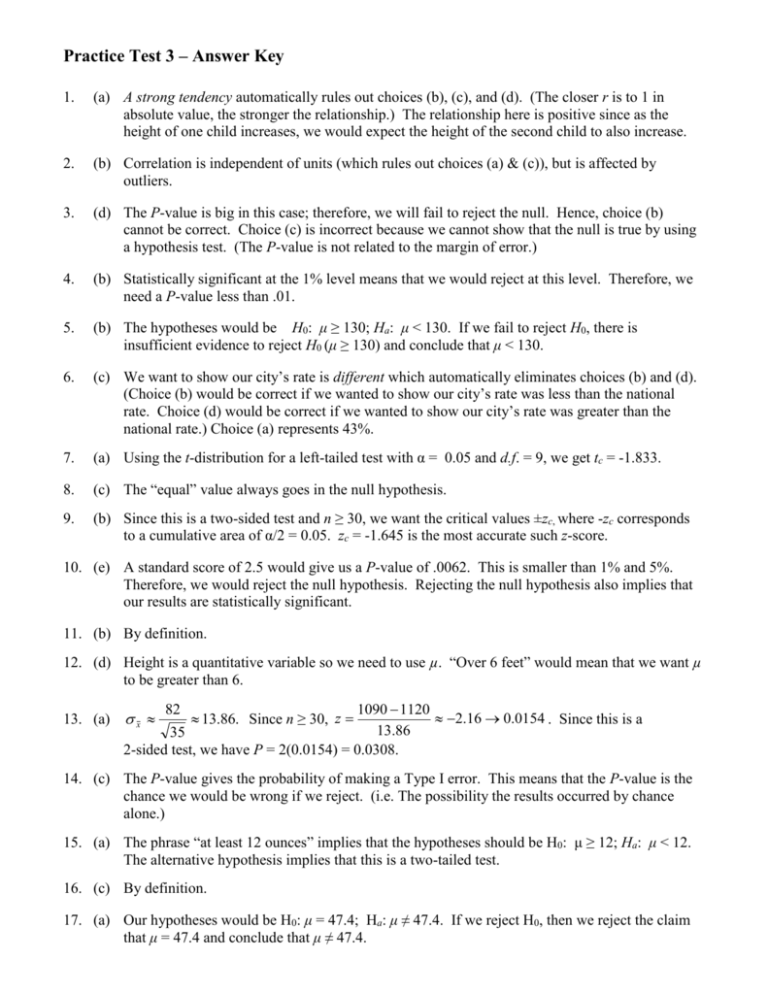
Practice Test 3 – Answer Key 1. (a) A strong tendency automatically rules out choices (b), (c), and (d). (The closer r is to 1 in absolute value, the stronger the relationship.) The relationship here is positive since as the height of one child increases, we would expect the height of the second child to also increase. 2. (b) Correlation is independent of units (which rules out choices (a) & (c)), but is affected by outliers. 3. (d) The P-value is big in this case; therefore, we will fail to reject the null. Hence, choice (b) cannot be correct. Choice (c) is incorrect because we cannot show that the null is true by using a hypothesis test. (The P-value is not related to the margin of error.) 4. (b) Statistically significant at the 1% level means that we would reject at this level. Therefore, we need a P-value less than .01. 5. (b) The hypotheses would be H0: μ ≥ 130; Ha: μ < 130. If we fail to reject H0, there is insufficient evidence to reject H0 (μ ≥ 130) and conclude that μ < 130. 6. (c) We want to show our city’s rate is different which automatically eliminates choices (b) and (d). (Choice (b) would be correct if we wanted to show our city’s rate was less than the national rate. Choice (d) would be correct if we wanted to show our city’s rate was greater than the national rate.) Choice (a) represents 43%. 7. (a) Using the t-distribution for a left-tailed test with α = 0.05 and d.f. = 9, we get tc = -1.833. 8. (c) The “equal” value always goes in the null hypothesis. 9. (b) Since this is a two-sided test and n ≥ 30, we want the critical values ±zc, where -zc corresponds to a cumulative area of α/2 = 0.05. zc = -1.645 is the most accurate such z-score. 10. (e) A standard score of 2.5 would give us a P-value of .0062. This is smaller than 1% and 5%. Therefore, we would reject the null hypothesis. Rejecting the null hypothesis also implies that our results are statistically significant. 11. (b) By definition. 12. (d) Height is a quantitative variable so we need to use µ. “Over 6 feet” would mean that we want µ to be greater than 6. 1090 1120 2.16 0.0154 . Since this is a 13.86 35 2-sided test, we have P = 2(0.0154) = 0.0308. 13. (a) x 82 13.86. Since n ≥ 30, z 14. (c) The P-value gives the probability of making a Type I error. This means that the P-value is the chance we would be wrong if we reject. (i.e. The possibility the results occurred by chance alone.) 15. (a) The phrase “at least 12 ounces” implies that the hypotheses should be H0: μ ≥ 12; Ha: μ < 12. The alternative hypothesis implies that this is a two-tailed test. 16. (c) By definition. 17. (a) Our hypotheses would be H0: μ = 47.4; Ha: μ ≠ 47.4. If we reject H0, then we reject the claim that μ = 47.4 and conclude that μ ≠ 47.4. 18. μ = the mean waiting time (in minutes) for all customers at the fast food outlet. H0: µ ≥ 4.9 n = 60 > 30 we can use a normal distribution Ha : µ < 4.9 α = 0.05, left-tailed Assume H0 is true (µ = 4.9). 4.8 4.9 .6 z 1.29 0.0985 = P-value x .0775 .0775 60 Since P > 0.05, we fail to reject H0 and fail to conclude that the mean waiting time for all customers is less than 4.9 minutes. (P = 0.0985) 19. μ = the average number of days worked by all laborers using the employment agency H0: µ = 120 α = 0.05 HA : µ ≠ 120 (Two-tailed) Assume H0 is true (µ = 120) 45 x 107 n 100 x 4.5 100 z 107 120 2.89 0.0019 4.5 P-value = 2(0.0019) = 0.0038 < 0.05 Reject H0 and conclude that µ ≠ 120. The average number of day worked by all laborers was not 120 (P = 0.0038). 20. This means that there is only a probability of .38% chance that this sample or one that was more extreme would occur by chance and that the null hypothesis is correct. In other words, given this sample result, there is only a .38% chance we have rejected the null hypothesis when we should not have. 21. μ = the mean waiting time (in minutes) for all passengers catching a bus during rush hour. H0: µ ≥ 7 n = 20 < 30, population normal use a t-distribution Ha : µ < 7 α = 0.01, left-tailed Critical value: tc = -2.539 Assume H0 is true (µ = 7). Rejection region: t < -2.539 5.2 7 2.1 t 3.83 x 0.4696 0.4696 20 Since t = -3.83 lies in the rejection region, we reject H0 in favor of Ha and conclude that the mean waiting time for all passengers is less than 7 minutes. (P < 0.005) 22. p = the proportion of all registered voters in the district that plan to vote for a Republican. H0: p ≥ 0.5 Ha : p < 0.5 Assume H0 is true (p = 0.5). α = 0.05, left-tailed pˆ 579 / 1200 .4825 .4825 .5 (0.5)(0.5) z 1.22 0.1112 = P-value. .0144 .0144 1200 Since P > 0.05, we fail to reject H0 and fail to conclude that the Republican candidate will lose. (P = 0.1112) pˆ 23. a) b) c) d) Null: The new anesthetic does not result in lower death rates than the other anesthetics. Alternative: The new anesthetic does result in lower death rates than the other anesthetics. Type I: We conclude that the new anesthetic does result in lower death rates than the other anesthetics when it actually does not. Type II: We fail to conclude that the new anesthetic does result in lower death rates than the other anesthetics when it actually does.
