Identifying Elements: Flame Tests & Spectroscopy Lab Report
advertisement
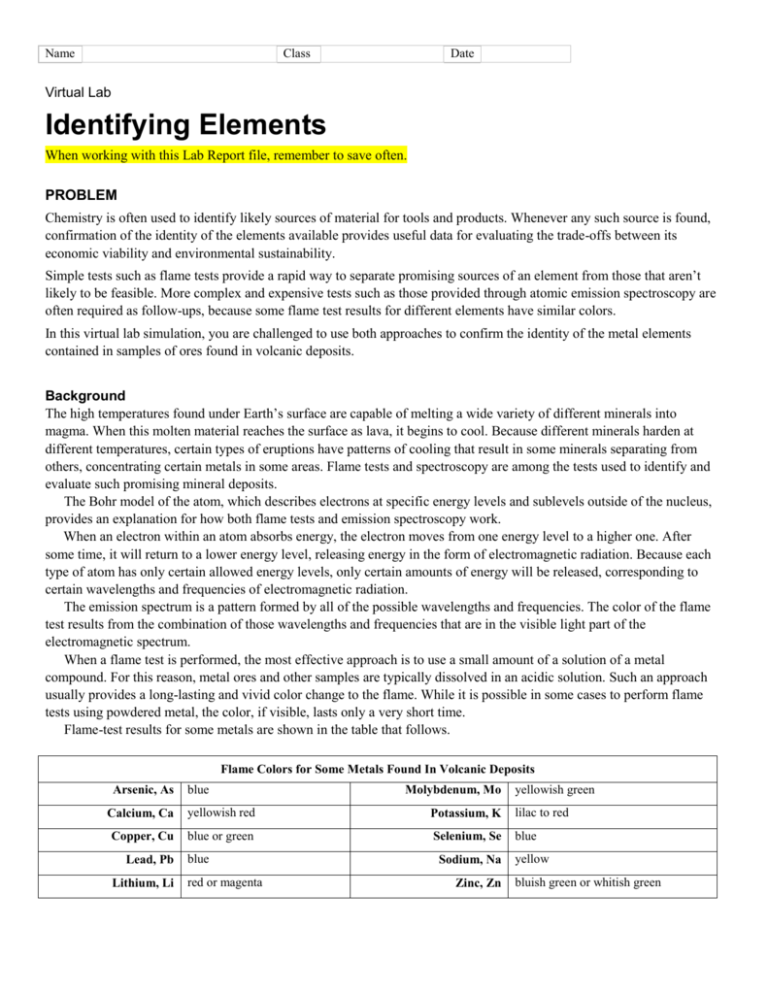
Name Class Date Virtual Lab Identifying Elements When working with this Lab Report file, remember to save often. PROBLEM Chemistry is often used to identify likely sources of material for tools and products. Whenever any such source is found, confirmation of the identity of the elements available provides useful data for evaluating the trade-offs between its economic viability and environmental sustainability. Simple tests such as flame tests provide a rapid way to separate promising sources of an element from those that aren’t likely to be feasible. More complex and expensive tests such as those provided through atomic emission spectroscopy are often required as follow-ups, because some flame test results for different elements have similar colors. In this virtual lab simulation, you are challenged to use both approaches to confirm the identity of the metal elements contained in samples of ores found in volcanic deposits. Background The high temperatures found under Earth’s surface are capable of melting a wide variety of different minerals into magma. When this molten material reaches the surface as lava, it begins to cool. Because different minerals harden at different temperatures, certain types of eruptions have patterns of cooling that result in some minerals separating from others, concentrating certain metals in some areas. Flame tests and spectroscopy are among the tests used to identify and evaluate such promising mineral deposits. The Bohr model of the atom, which describes electrons at specific energy levels and sublevels outside of the nucleus, provides an explanation for how both flame tests and emission spectroscopy work. When an electron within an atom absorbs energy, the electron moves from one energy level to a higher one. After some time, it will return to a lower energy level, releasing energy in the form of electromagnetic radiation. Because each type of atom has only certain allowed energy levels, only certain amounts of energy will be released, corresponding to certain wavelengths and frequencies of electromagnetic radiation. The emission spectrum is a pattern formed by all of the possible wavelengths and frequencies. The color of the flame test results from the combination of those wavelengths and frequencies that are in the visible light part of the electromagnetic spectrum. When a flame test is performed, the most effective approach is to use a small amount of a solution of a metal compound. For this reason, metal ores and other samples are typically dissolved in an acidic solution. Such an approach usually provides a long-lasting and vivid color change to the flame. While it is possible in some cases to perform flame tests using powdered metal, the color, if visible, lasts only a very short time. Flame-test results for some metals are shown in the table that follows. Flame Colors for Some Metals Found In Volcanic Deposits Arsenic, As blue Molybdenum, Mo yellowish green Calcium, Ca yellowish red Potassium, K lilac to red Copper, Cu blue or green Selenium, Se blue Lead, Pb Lithium, Li blue red or magenta Sodium, Na Zinc, Zn yellow bluish green or whitish green PLANNING Goal Identify an element based on its flame test and emission spectrum. Objectives Relate electron transitions within an atom to emission of specific frequencies of light. Explain the color of a flame test based on the emission of light. Demonstrate how to identify an unknown element by comparing its detailed emission spectrum to a library of standard, known spectra. Evaluate how well emission spectra could work in identifying a mixture of elements. Materials This virtual lab requires: • A computer capable of running the simulation • A sound card with speakers to play the audio • An Internet browser with Adobe Flash Player 10 or above installed Reality Check The processes of performing flame tests and checking atomic emission spectra have been simplified for the purposes of this lab. An advantage of the virtual lab is that the process can be redone over and over without running out of mineral samples. The procedures shown in this lab are not suitable for a real-world experiment. Raw samples of mineral ores are likely to contain enough trace impurities to make positive identification through spectroscopy more complicated than depicted. Your Plan Adjust or replace the following sample procedure to suit your plan for performing the virtual lab. Be sure to provide more detail about exactly how you plan to accomplish the second step. a. Choose one mineral sample. b. Prepare sample for the flame test using the tools and reagents available. First, use the hammer to collect some powder from the sample. Place the powder in the beaker, and dissolve it in acid. Dip the wire loop in the solution. c. Insert the wire loop with solution into the flame and observe and record its color. d. Compare your results to other flame-test results to narrow the possibilities for the metal. e. Observe the full emission spectrum of the sample, recording the color and wavelength of some of the key lines. OBSERVATIONS (PERFORM) 1. Performing Flame Tests: Perform the first experiment on one of the minerals. Enter the sample number and observations for the sample in the first column below. 2. Interpreting Flame Tests: Given the results of your flame test, were you able to narrow the possibilities? List the metals that are likeliest and actual flame test color for each of them in the data table below. Depending on the sample you choose, you may not need all the columns in the table. Data Table Sample: _______ Likely metal 1: __________ Likely metal 2: ___________ Likely metal 3: ___________ Flame test color Other observations ANALYSIS AND INTERPRETATIONS 3. Analyzing Spectrometry Results: In the table below, enter your observations for your sample mineral. Compare six of the spectral lines from your unknown sample to the known samples of metals that you chose earlier as the most likely candidates for your unknown. List these metals table at the top of the column. Enter Y or N to indicate if the actual data for the likely metal matches the data from your sample. Emission Spectra Comparisons Sample # ______ Actual results Spectral line color 1 Line wavelength 1 (nm) Spectral line color 2 Line wavelength 2 (nm) Spectral line color 3 Line wavelength 3 (nm) Spectral line color 4 Line wavelength 4 (nm) Spectral line color 5 Line wavelength 5 (nm) Spectral line color 6 Line wavelength 6 (nm) Match with likely metal 1: _______? Match with likely metal 2: _______? Match with likely metal 3: _______? 4. Evaluating Methods: Explain why you usually can’t use just a single spectral line to confirm the identity of an element. SUMMARY AND CONCLUSION 5. Results Identify the unknown. Explain how you were able to do this. 6. Reflections Magnesium metal burns with a bright white flame. What conclusions can you draw about the electron transitions that can take place for a magnesium atom? 7. Reflections Would you be able to use a similar approach to identify a mixture of two or three elements with emission spectrum analysis? Why or why not? 8. Conclusions: How did the conclusions you could draw from the flame-test results differ from the conclusions you could draw from the emission spectrometry results? 9. Relating Wavelength to Energy Level Differences: During your work with the model set of energy levels, if you were trying to get a line to move from the green part of the spectrum toward the orange or red end of the spectrum, would you drag its energy level to be closer to or farther from the lowest energy level? Explain your answer. 10 Evaluating Limitations of Models: The model set of energy levels only included levels for n = 2 through n = 6. If n = 7 had been included, in what part of the electromagnetic spectrum would you expect its transition lines to have been found? Why? Copyright © Houghton Mifflin Harcourt Publishing Company

