Supporting Information S2: Quantitative analysis by XPS
advertisement
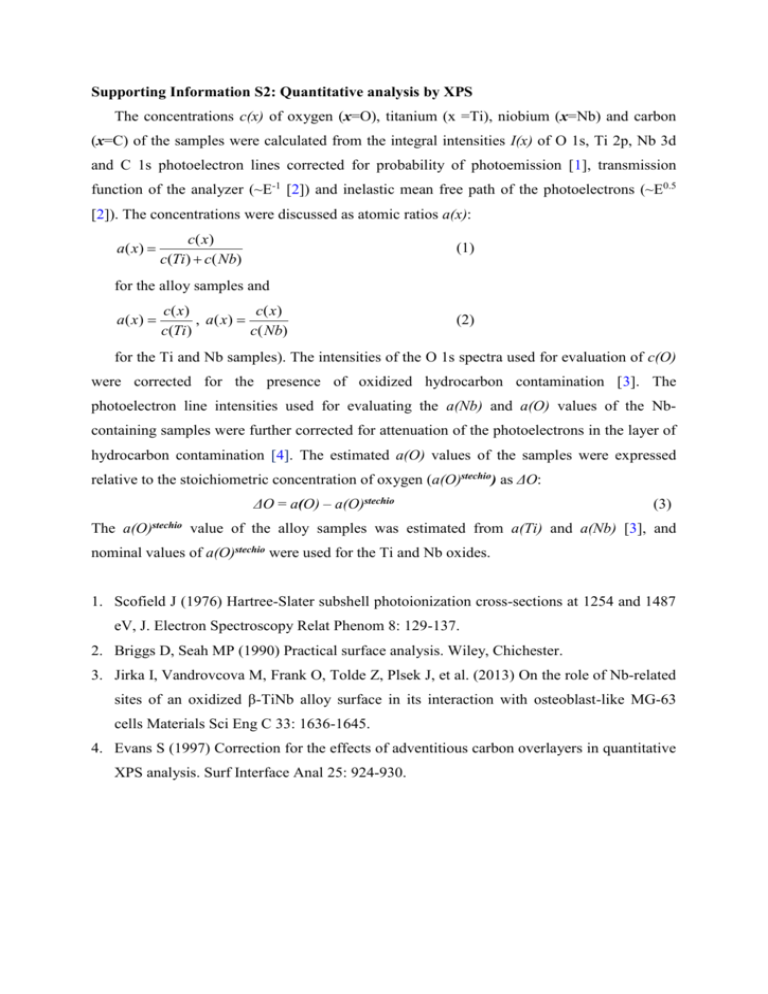
Supporting Information S2: Quantitative analysis by XPS The concentrations c(x) of oxygen (x=O), titanium (x =Ti), niobium (x=Nb) and carbon (x=C) of the samples were calculated from the integral intensities I(x) of O 1s, Ti 2p, Nb 3d and C 1s photoelectron lines corrected for probability of photoemission [1], transmission function of the analyzer (~E-1 [2]) and inelastic mean free path of the photoelectrons (~E0.5 [2]). The concentrations were discussed as atomic ratios a(x): a ( x) c( x) c(Ti) c( Nb) (1) for the alloy samples and a( x) c( x) c( x) , a( x) c(Ti ) c( Nb) (2) for the Ti and Nb samples). The intensities of the O 1s spectra used for evaluation of c(O) were corrected for the presence of oxidized hydrocarbon contamination [3]. The photoelectron line intensities used for evaluating the a(Nb) and a(O) values of the Nbcontaining samples were further corrected for attenuation of the photoelectrons in the layer of hydrocarbon contamination [4]. The estimated a(O) values of the samples were expressed relative to the stoichiometric concentration of oxygen (a(O)stechio) as ΔO: ΔO = a(O) – a(O)stechio (3) The a(O)stechio value of the alloy samples was estimated from a(Ti) and a(Nb) [3], and nominal values of a(O)stechio were used for the Ti and Nb oxides. 1. Scofield J (1976) Hartree-Slater subshell photoionization cross-sections at 1254 and 1487 eV, J. Electron Spectroscopy Relat Phenom 8: 129-137. 2. Briggs D, Seah MP (1990) Practical surface analysis. Wiley, Chichester. 3. Jirka I, Vandrovcova M, Frank O, Tolde Z, Plsek J, et al. (2013) On the role of Nb-related sites of an oxidized β-TiNb alloy surface in its interaction with osteoblast-like MG-63 cells Materials Sci Eng C 33: 1636-1645. 4. Evans S (1997) Correction for the effects of adventitious carbon overlayers in quantitative XPS analysis. Surf Interface Anal 25: 924-930.
