Table S5 - Figshare
advertisement
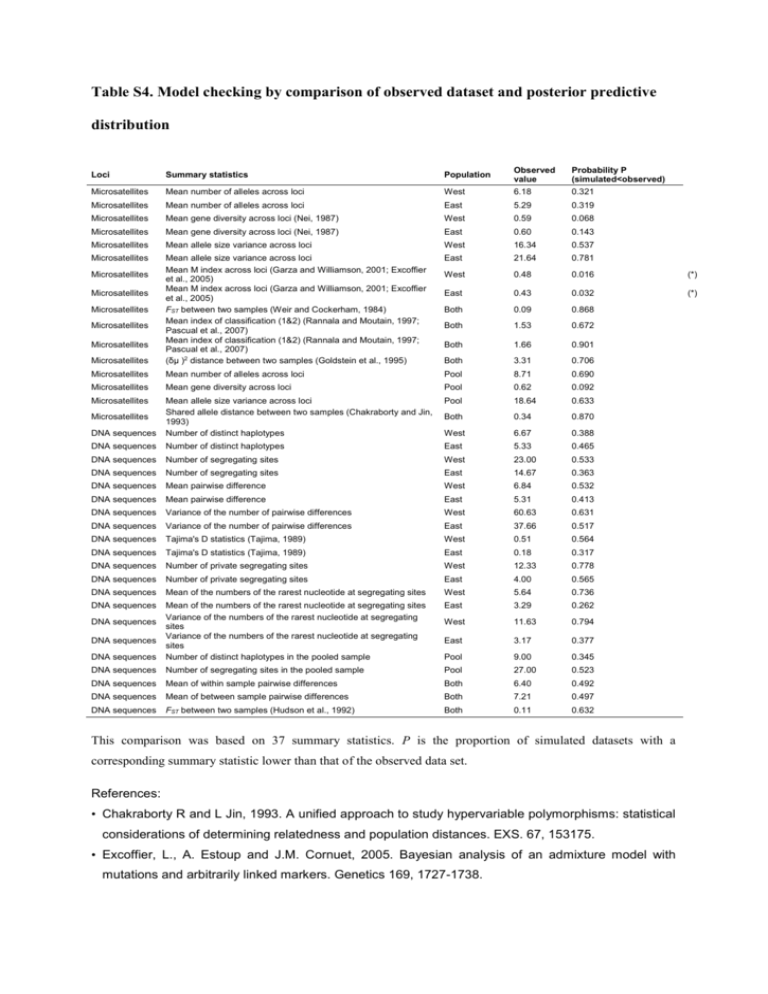
Table S4. Model checking by comparison of observed dataset and posterior predictive distribution West Observed value 6.18 Probability P (simulated<observed) 0.321 East 5.29 0.319 West 0.59 0.068 Mean gene diversity across loci (Nei, 1987) East 0.60 0.143 Microsatellites Mean allele size variance across loci West 16.34 0.537 Microsatellites East 21.64 0.781 West 0.48 0.016 (*) East 0.43 0.032 (*) Both 0.09 0.868 Both 1.53 0.672 Both 1.66 0.901 Microsatellites Mean allele size variance across loci Mean M index across loci (Garza and Williamson, 2001; Excoffier et al., 2005) Mean M index across loci (Garza and Williamson, 2001; Excoffier et al., 2005) FST between two samples (Weir and Cockerham, 1984) Mean index of classification (1&2) (Rannala and Moutain, 1997; Pascual et al., 2007) Mean index of classification (1&2) (Rannala and Moutain, 1997; Pascual et al., 2007) (δμ )2 distance between two samples (Goldstein et al., 1995) Both 3.31 0.706 Microsatellites Mean number of alleles across loci Pool 8.71 0.690 Microsatellites Mean gene diversity across loci Pool 0.62 0.092 Microsatellites Pool 18.64 0.633 Both 0.34 0.870 DNA sequences Mean allele size variance across loci Shared allele distance between two samples (Chakraborty and Jin, 1993) Number of distinct haplotypes West 6.67 0.388 DNA sequences Number of distinct haplotypes East 5.33 0.465 DNA sequences Number of segregating sites West 23.00 0.533 DNA sequences Number of segregating sites East 14.67 0.363 DNA sequences Mean pairwise difference West 6.84 0.532 DNA sequences Mean pairwise difference East 5.31 0.413 DNA sequences Variance of the number of pairwise differences West 60.63 0.631 DNA sequences Variance of the number of pairwise differences East 37.66 0.517 DNA sequences Tajima's D statistics (Tajima, 1989) West 0.51 0.564 DNA sequences Tajima's D statistics (Tajima, 1989) East 0.18 0.317 DNA sequences Number of private segregating sites West 12.33 0.778 DNA sequences Number of private segregating sites East 4.00 0.565 DNA sequences Mean of the numbers of the rarest nucleotide at segregating sites West 5.64 0.736 DNA sequences East 3.29 0.262 West 11.63 0.794 East 3.17 0.377 DNA sequences Mean of the numbers of the rarest nucleotide at segregating sites Variance of the numbers of the rarest nucleotide at segregating sites Variance of the numbers of the rarest nucleotide at segregating sites Number of distinct haplotypes in the pooled sample Pool 9.00 0.345 DNA sequences Number of segregating sites in the pooled sample Pool 27.00 0.523 DNA sequences Mean of within sample pairwise differences Both 6.40 0.492 DNA sequences Mean of between sample pairwise differences Both 7.21 0.497 DNA sequences FST between two samples (Hudson et al., 1992) Both 0.11 0.632 Loci Summary statistics Population Microsatellites Mean number of alleles across loci Microsatellites Mean number of alleles across loci Microsatellites Mean gene diversity across loci (Nei, 1987) Microsatellites Microsatellites Microsatellites Microsatellites Microsatellites Microsatellites Microsatellites DNA sequences DNA sequences This comparison was based on 37 summary statistics. P is the proportion of simulated datasets with a corresponding summary statistic lower than that of the observed data set. References: • Chakraborty R and L Jin, 1993. A unified approach to study hypervariable polymorphisms: statistical considerations of determining relatedness and population distances. EXS. 67, 153175. • Excoffier, L., A. Estoup and J.M. Cornuet, 2005. Bayesian analysis of an admixture model with mutations and arbitrarily linked markers. Genetics 169, 1727-1738. • Garza JC and E Williamson, 2001. Detection of reduction in population size using data from microsatellite DNA. Mol. Ecol. 10,305-318. • Goldstein DB, Linares AR, Cavalli-Sforza LL, and Feldman MW, 1995. An evaluation of genetic distances for use with microsatellite loci. Genetics 139, 463-471. • Hudson,R. R., M. Slatkin and W.P. Maddison, 1992. Estimation of levels of gene flow from DNA sequence data. Genetics, 132, 583-589. • Nei M., 1987. Molecular Evolutionary Genetics. Columbia University Press, New York, 512 pp. • Pascual, M., M.P. Chapuis, F. Mestres, J. Balany_a, R.B. Huey, G.W. Gilchrist, L. Serra and A. Estoup, 2007. Introduction history of Drosophila subobscura in the New World: a microsatellite based survey using ABC methods. Mol. Ecol., 16, 3069-3083. • Rannala, B., and J. L. Mountain, 1997. Detecting immigration by using multilocus genotypes. Pro. Nat. Acad. Sci. USA 94, 9197-9201. • Tajima, F., 1989. Statistical method for testing the neutral mutation hypothesis by DNA polymorphism. Genetics 123: 585-595 • Weir BS and CC Cockerham, 1984. Estimating F-statistics for the analysis of population structure. Evolution 38: 1358-1370.

