jane12246-sup-0001-Suppinfo
advertisement
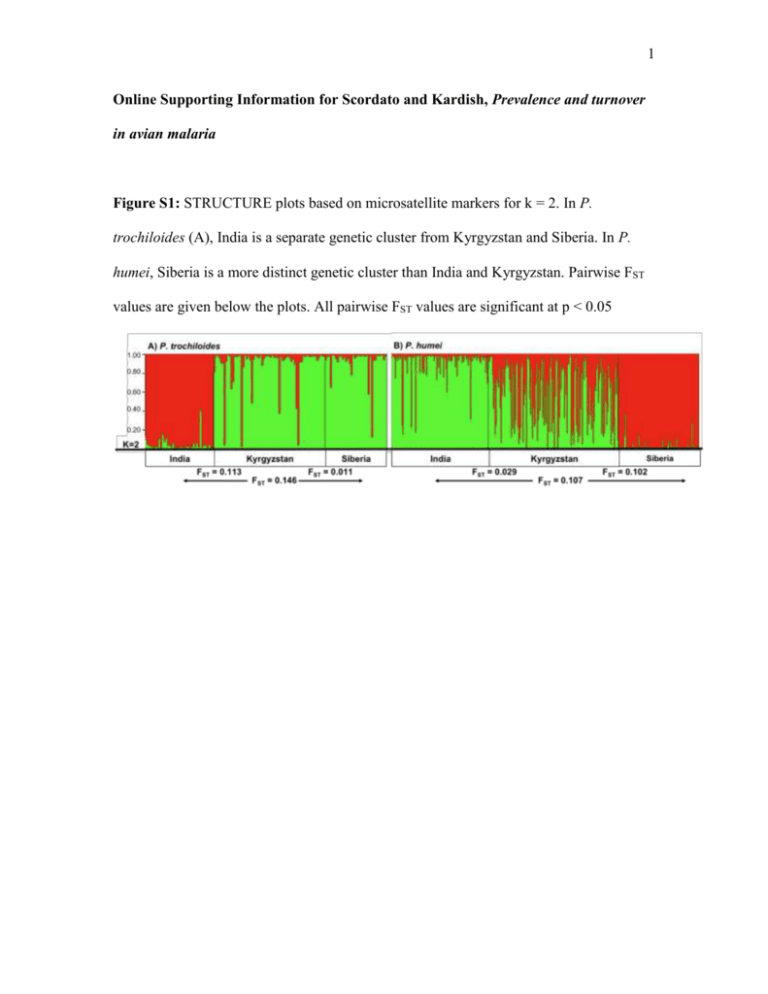
1 Online Supporting Information for Scordato and Kardish, Prevalence and turnover in avian malaria Figure S1: STRUCTURE plots based on microsatellite markers for k = 2. In P. trochiloides (A), India is a separate genetic cluster from Kyrgyzstan and Siberia. In P. humei, Siberia is a more distinct genetic cluster than India and Kyrgyzstan. Pairwise FST values are given below the plots. All pairwise FST values are significant at p < 0.05 2 Appendix S1 Microsatellite marker development for P. trochiloides Microsatellites were developed from samples collected in Indian birds. Approximately 3 ug of DNA were extracted using Qiagen DNEasy blood and tissue kits. Isolated DNA was used to construct a genomic library enriched for DNA fragments containing microsatellite repeats, as described in Price et al 2008. Primers were designed for 10 loci, of which eight produced reliable genotypes. We typed 141 P. trochioides used in this study at eight loci. Primers were fluorescently labeled with FAM, HEX, or NED and run in multiplex. Samples were run in 10l reactions with 1 l genomic DNA, 5 l HotStarTaq Plus Mastermix (Qiagen), and 1 M of each primer. The thermocycler profile consisted of an initial denaturing step at 95˚C for 5 minutes, followed by 35 cycles at 94˚C for 20 seconds, 20 seconds at the appropriate annealing temperature, and 45 seconds at 72˚C, followed by an elongation of 10 minutes at 72˚C. Primers 9-16 were run at an annealing temperature of 65, 17-24 at an annealing temperature of 68. Genotyping was conducted at the University of Chicago Cancer Research Center. Variability estimates and exclusion probabilities for each locus were determined in Arlequin. After genotyping all three populations, it was found that two loci (Ptroch13 and Ptroch17) were not in Hardy-Weinberg equilibrium and were dropped from subsequent analysis. Primer sequences are given in Table S1. Detection of parasite infections 3 To detect Haemoproteus and Plasmodium parasite infections, we used nested PCR to amplify a 462 base pair portion of the cytochrome b gene from malaria mitochondrial DNA (modified from Waldenström et al. 2004). Samples were run in 10l reactions with 1 l genomic DNA, 5 l HotStarTaq Plus Mastermix (Qiagen), and 1 M of each of the HAEMNF (5’-CATATATTAAGAGAATTATGGAG-3’) and HAEMNR2 (5’-AGAGGTGTAGCATATCTATCTAC-3’) primers. Samples were denatured at 95˚C for 5 minutes, followed by 35 cycles at 94˚C for 30 seconds, 54˚C for 45 seconds, and 72˚C for 45 seconds, followed by an elongation of 10 minutes at 72˚C. We then added 1l PCR product to 5l HotStarTaq Plus Mastermix (Qiagen) and 1M of the primers HAEMF (5’-ATGGTGCTTTCGATATATGCATG-3’) and HAEMR2 (5’GCATTATCTGGATGTGATAATGGT-3’). The second set of reactions were denatured at 95˚C for 5 minutes followed by 35 cycles at 94˚C for 30 seconds, 58˚C for 45 seconds, and 72˚C for 45 seconds, followed by an elongation of 10 minutes at 72˚C. We optimized our PCR temperature protocol using positive controls provided by S. Bensch (pers. comm.). We screened PCR products for presence of parasite DNA on 1.5% agarose gels; positive samples produced a band of between 400 and 500 base pairs, whereas negative samples produced no band. Positive samples were sequenced directly from the 5’-end with the primer HAEMF on an ABI 3730XL DNA Analyzer (Applied Biosystems) at the University of Chicago Cancer Research Center. Phylogenetic and population genetic analysis To assess phylogenetic relationships among malarial strains, parasite mtDNA sequences were edited and aligned in CodonCode Aligner (CodonCode Corporation). All 4 sequences were visually inspected for double peaks, which we considered indicative of a mixed infection (n = 5). These sequences were not included in phylogenetic analysis. We performed a BLAST search on all unique malaria haplotypes to identify previously sequenced strains. Sequences for all unique strains are deposited in GenBank (Accession nos. KJ396623-KJ396639). The phylogeny was assembled in MrBayes v. 3.1.2 (Ronquist and Huelsenbeck 2003) using the General Time Reversible model with gamma distributed rate variation among sites (GTR+G) as suggested by jModelTest 0.1.1 (Posada 2008). Two simultaneous runs were conducted with a sampling frequency of every 250 generations over three million generations. We discarded 30% of the samples as burn-in period and used Plasmodium falciparum (GenBank Accession no. AF069609) as an outgroup. Trees were visualized in FigTree v. 1.3.1 (http://tree.bio.ed.ac.uk/software/figtree/). A minimum spanning tree constructed in Arlequin v. 3.5 (Excoffier, Laval & Schneider 2005) was drawn by hand. We analyzed host genetic structure by calculating pairwise FST in microsatellite frequencies between adult birds in the three populations of P. humei and P. trochiloides in Arlequin. We then assessed levels of genetic clustering among the three populations using the Bayesian likelihood method implemented in STRUCTURE (Pritchard, Stephens & Donnelly 2000), which calculates the posterior probability of individuals belonging to one of k populations. We used an admixture model with correlated allele frequencies, set lambda = 1, and allowed alpha to be determined from the data (Falush, Stephens & Pritchard 2003). For each value of k between 1 and 5 we ran 5 simulations, using a one million generation burn-in and two million generations to calculate posterior 5 probabilities. We selected the most likely number of populations by calculating ∆K (Evanno, Regnaut & Goudet 2005) with Structure Harvester (Earl and vonHoldt 2012). 6 Table S1: Primer sequences and diagnostic information for eight new microsatellite loci in P. trochiloides. Boldfaced primers were not in Hardy-Weinberg equilibrium in all populations and were dropped from population genetic analyses. Supplemental References Earl, D.A. & vonHoldt, B. M. (2012) STRUCTURE HARVESTER: a website and program for visualizing STRUCTURE output and implementing the Evanno method. Conservation Genetics Resources, 4, 359–361. Evanno, G., Regnaut, S. & Goudet, J. (2005) Detecting the number of clusters of individuals using the software STRUCTURE: a simulation study. Molecular Ecology, 14, 2611–2620. Falush, D., Stephens, M. & Pritchard, J.K. (2003) Inference of population structure using multilocus genotype data: linked loci and correlated allele frequencies. Genetics, 164, 1567–1587. Posada, D. (2008) jModelTest: phylogenetic model averaging. Molecular biology and evolution, 25, 1253–1256. Price, T.D., Yeh, P.J. & Harr, B. (2008) Phenotypic plasticity and the evolution of a socially selected trait following colonization of a novel environment. American Naturalist, 172, S49-S62. 7 Waldenström, J., Bensch, S., Hasselquist, D. & Östman, Ö. (2004) A new nested polymerase chain reaction method very efficient in detecting Plasmodium and Haemoproteus infections from avian blood. Journal of Parasitology, 90, 191–194.
