chp12_section1_seta_ans
advertisement
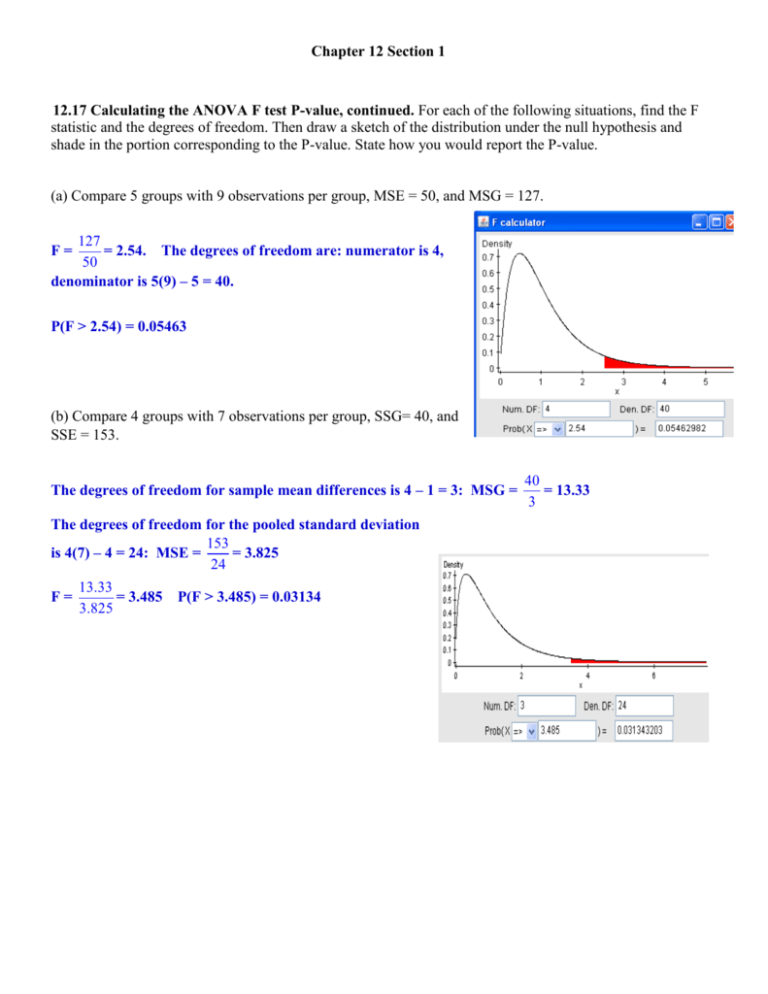
Chapter 12 Section 1 12.17 Calculating the ANOVA F test P-value, continued. For each of the following situations, find the F statistic and the degrees of freedom. Then draw a sketch of the distribution under the null hypothesis and shade in the portion corresponding to the P-value. State how you would report the P-value. (a) Compare 5 groups with 9 observations per group, MSE = 50, and MSG = 127. 127 = 2.54. The degrees of freedom are: numerator is 4, 50 denominator is 5(9) – 5 = 40. F= P(F > 2.54) = 0.05463 (b) Compare 4 groups with 7 observations per group, SSG= 40, and SSE = 153. The degrees of freedom for sample mean differences is 4 – 1 = 3: MSG = The degrees of freedom for the pooled standard deviation 153 is 4(7) – 4 = 24: MSE = = 3.825 24 F= 13.33 = 3.485 3.825 P(F > 3.485) = 0.03134 40 = 13.33 3 FOR PROBLEMS 18 AND 19 YOU WILL NEED TO USE THE APPLET FOUND AT WWW.WHFREEMAN.COM/IPS6E LOOK AT THE APPLETS SECTION, SCROLL DOWN TO THE BOTTOM; IT IS THE LAST APPLET. 12.18 The effect of increased variation within groups. The One-Way ANOVA applet lets you see how the F statistic and the P-value depend on the variability of the data within groups and the differences among the means. (a) The black dots are at the means of the three groups. Move these up and down until you get a configuration that gives a P-value of about 0.01. What is the value of the F statistic? I got an F value of about 5.537 which just about corresponded to a p-value of 0.01. I can see from the graph, that actual pvalue is little larger than 0.01. (b) Now increase the variation within the groups by dragging the mark on the pooled standard error scale to the right. Describe what happens to the F statistic and the P-value. Explain why this happens. The default value on the pooled standard deviation slider was all the way to the left, thus, I could only move to the right. As I moved the slider to the right, increase the pooled standard deviation, the individual group spread increased while the means of each group did not change. As the spread increased the F statistic decreased to below 1, increasing the p-value near 1. Notice that as F decreases in value, the p-value increases getting closer to the limit of 1. Why does this happen? As the spread increases within each group, it makes the difference between the means, insignificant, that is, I am willing to believe that the means of each group are the same and the variation between the sample means that I am witnessing is due to random variation. Look at the Situation where p-value is 0.01. The means for each group are not different. But now the spreads are so close together that I can see clearly that at least one group is different; the green group I would guess has a slightly smaller mean. WARNING: if we find a result statistically significant, it does NOT mean the result difference is LARGE. We are merely stating that this is different. So the picture shows that there is a difference in the means, from what I can see, it is hard to tell if the difference is large (from the picture it does not appear that way) since there is no vertical scale, but in any case the difference seems to be real. 12.19 The effect of increased variation between groups. Set the pooled standard error for the One-Way ANOVA applet at a middle value. Drag the black dots so that they are approximately equal. (a) What is the F statistic? Give its P-value. The p-value is near 1, which corresponds to an F value of 0.0126. The interpretation is that there is no difference between means. (b) Drag the mean of the second group up and the mean of the third group down. Describe the effect on the F statistic and its P-value. Explain why they change in this way. As the means change in difference then the F –value starts to increase, which means that we are increasing the amount of evidence to support the alternative hypothesis that at least one of the means is different. We are trying to find if there is a difference in the means. If we continue to change the means so the difference increases then the evidence will begin to mount; larger F-value and smaller p-value. Also I changed the group means in opposite direction increasing the difference between all three. If I move the last group mean upward then the F-value should decrease. 12.20 Calculating the pooled standard deviation. An experiment was run to compare four groups. The sample sizes were 25, 28, 150, and 21, and the corresponding estimated standard deviations were 42, 38, 20, and 45. (a) Is it reasonable to use the assumption of equal standard deviations when we analyze these data? Give a reason for your answer. Smaller s value = 20. 2(20) = 40. Now 40 is not greater than 45. So the rule of thumb is not met. 2smallest > slargest. (b) Give the values of the variances for the four groups. 422 = 2025 382 =1444 202 = 400 452 = 2025. (c) Find the pooled variance. 24(2025) + 27(1444) + 149(400) + 20(2025) = 853.13 25 + 28 + 150 + 21 - 4 (d) What is the value of the pooled standard deviation? 853.13 ≈ 29.21 (e) Explain why your answer in part (d) is much closer to the standard deviation for the third group than to any of the other standard deviations. The third group accounted for 150 values out of the total of 224 values. The formula for calculating pooled standard deviation accounts for the sample size by multiplying each individual standard deviation by its degrees of freedom (n - 1). This type of calculation is called weighted. Thus the value of 20 for the standard deviation was given more “weight” than the other values. 12.34 Air quality in poultry-processing plants. The air in poultry-processing plants often contains fungus spores. If the ventilation is inadequate, this can affect the health of the workers. To measure the presence of spores, air samples are pumped to an agar plate, and "colony-forming units (CPUs)" are counted after an incubation period. Here are data from the "kill room" of a plant that slaughters 37,000 turkeys per day, taken at four seasons of the year. The units are CFUs per cubic meter of air." Fall 1231 1254 1088 Winter 987 778 852 Spring 2054 2092 1902 Summer 1452 1521 1352 (a) Examine the data using graphs and descriptive measures. How do airborne fungus spores vary with the seasons? The graphs clearly illustrate that there is a difference between the means. The sample means look different, the overlap between the groups is non-existence, so it is hard to imagine that these 12 data values came from a distribution with the same mean. The standard deviations look about the same, and it is easy to believe that this is the case. If appears that the spore count is larger on average during the Spring, and by Winter it decreases to its lowest point. (b) Is the effect of season statistically significant? When we run the formal test I am expecting to see a tiny p-value. As a matter of fact I would guess about 8.2 X 10⁻⁸, clearly statistically significant. Summary statistics: Column n Fall 3 Winter 3 Spring 3 Mean Variance 1191 Std. Dev. Std. Err. 8089 89.938866 51.92623 872.3333 11230.333 105.97327 61.183693 2016 10108 100.53855 Summer 3 1441.6666 7220.3335 Sample mean regardless of group x = 84.97254 58.04596 49.05892 1191(3) 872.33(3) 2016(3) 1441.67(3) = 1380.25 12 SSG = 3(1191 – 1380.25)2 + 3(872.33 – 1380.25)2 + 3(2016 – 1380.25)2 + 3(1441.67 – 1380.25)2 = 2105234.92 SSE = 2(8089) + 2(11230.33) + 2(10108) + 2(7220.33) = 73,295.32 = sp2 ANOVA Source of Variation Between Groups (difference between means) SS 2105234.92 df 3 called sometimes within groups 73295.32 8 Total variation regardless of group, s, calculated by grouping entire data set as one. 2178530.25 11 MS F P-value Error (Estimating the pooled standard deviation) For the groups I = 4, thus the degrees of freedom is 4 – 1 3. MSG = 2105234.92 = 701744.97 3 For the pooling situation, ni = 4 for each group, thus N = 12. The degrees of freedom for pooling is N 73295.32 – 1, or 12 – 4 = 8. MSE = = 9161.92 8 ANOVA Source of Variation Between Groups (difference between means) SS 2105234.92 df 3 MS 701744.97 called sometimes within groups 73295.32 8 9161.92 Total variation regardless of group, s, calculated 2178530.25 11 Error (Estimating the pooled standard deviation) F P-value by grouping entire data set as one. Finally the F statistics is F = 701744.97 = 76.59. 9161.92 Finally P(F > 76.59) with 3 df and 8 d.f. is 3.1 x 10⁻⁶. ANOVA Source of Variation Between Groups (difference between means) SS 2105234.92 df 3 MS 701744.97 called sometimes within groups 73295.32 8 9161.92 Total variation regardless of group, s, calculated by grouping entire data set as one. 2178530.25 11 Error (Estimating the pooled standard deviation) F 76.59 P-value 3.1x10⁻⁶

