pH Lab Rev
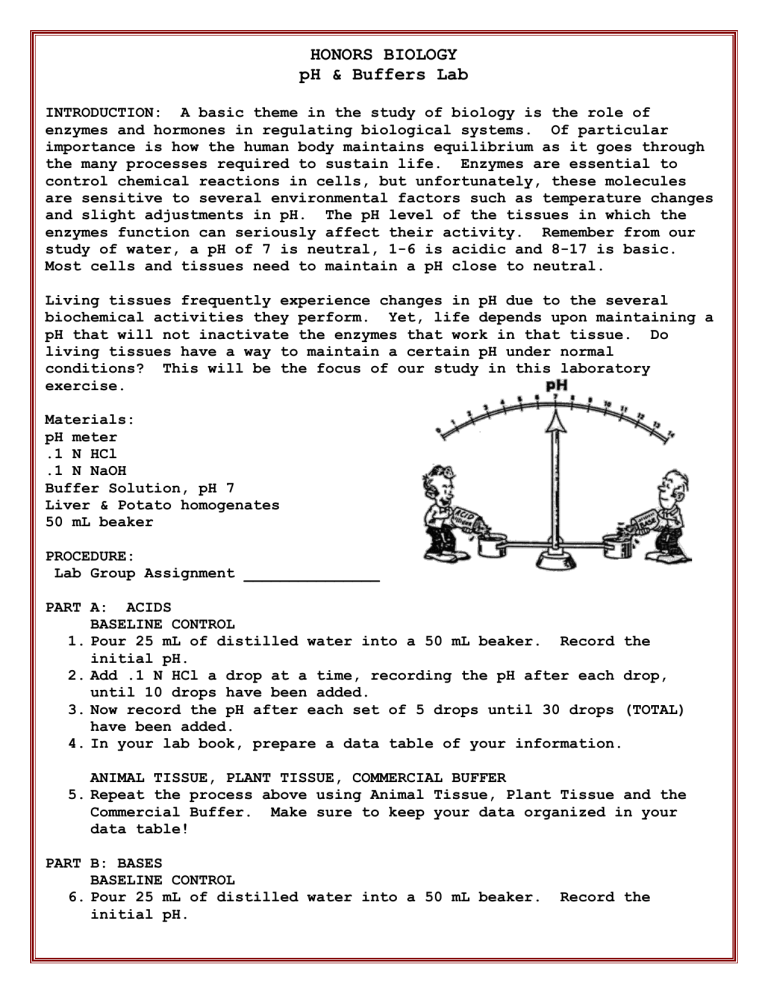
HONORS BIOLOGY pH & Buffers Lab
INTRODUCTION: A basic theme in the study of biology is the role of enzymes and hormones in regulating biological systems. Of particular importance is how the human body maintains equilibrium as it goes through the many processes required to sustain life. Enzymes are essential to control chemical reactions in cells, but unfortunately, these molecules are sensitive to several environmental factors such as temperature changes and slight adjustments in pH. The pH level of the tissues in which the enzymes function can seriously affect their activity. Remember from our study of water, a pH of 7 is neutral, 1-6 is acidic and 8-17 is basic.
Most cells and tissues need to maintain a pH close to neutral.
Living tissues frequently experience changes in pH due to the several biochemical activities they perform. Yet, life depends upon maintaining a pH that will not inactivate the enzymes that work in that tissue. Do living tissues have a way to maintain a certain pH under normal conditions? This will be the focus of our study in this laboratory exercise.
Materials: pH meter
.1 N HCl
.1 N NaOH
Buffer Solution, pH 7
Liver & Potato homogenates
50 mL beaker
PROCEDURE:
Lab Group Assignment _______________
PART A: ACIDS
BASELINE CONTROL
1.
Pour 25 mL of distilled water into a 50 mL beaker. Record the initial pH.
2.
Add .1 N HCl a drop at a time, recording the pH after each drop, until 10 drops have been added.
3.
Now record the pH after each set of 5 drops until 30 drops (TOTAL) have been added.
4.
In your lab book, prepare a data table of your information.
ANIMAL TISSUE, PLANT TISSUE, COMMERCIAL BUFFER
5.
Repeat the process above using Animal Tissue, Plant Tissue and the
Commercial Buffer. Make sure to keep your data organized in your data table!
PART B: BASES
BASELINE CONTROL
6.
Pour 25 mL of distilled water into a 50 mL beaker. Record the initial pH.
7.
Add .1 N NaOH drop by drop, recording the pH after each drop, until
10 drops have been added.
8.
After 10 drops, proceed 5 drops at a time until 30 drops have been added. (Total of 30 drops)
9.
In your lab book, prepare a data table of your information.
ANIMAL TISSUE, PLANT TISSUE, COMMERCIAL BUFFER
10.
Repeat the process above using Animal Tissue, Plant Tissue and the Commercial Buffer. Make sure to keep your data organized in your data table!
PART C: DATA COLLECTION & GRAPHING
11.
Before you construct your graph you will need to collect the remaining data. If you worked with ACIDS, find a lab group that worked with BASES and swap data. Make sure to note in your lab book which group’s data you will be using.
12.
Make a graph, plotting the pH measured against the # of drops added. Use different colors and make a key so you can record both
Part A and B on the same graph.
13.
Summarize the information presented in your graph.
PART D: CONCLUSION
14.
In your summary, make sure to respond to the following questions: a.
Does there seem to be a steady increase or a sudden jump? b.
Is there any correlation between the number of drops and the change in pH? c.
Does the potato react for like the liver or the water? d.
How do you account for this? e.
What was the total pH change for the 30 drops of acid added to the liver? To the potato? f.
What was the total pH change for the 30 drops of base added? To the potato? g.
How do these differ from the distilled water? h.
How do you account for the difference in the liver and potato homogenates vs. the water? i.
Is the action of the Commercial Buffer more like the water or the liver and potato? j.
What does this tell you about living cells? k.
Find two specific biological examples in which there is an advantage of having buffers in cells. Describe these examples.
