pH Lab
advertisement
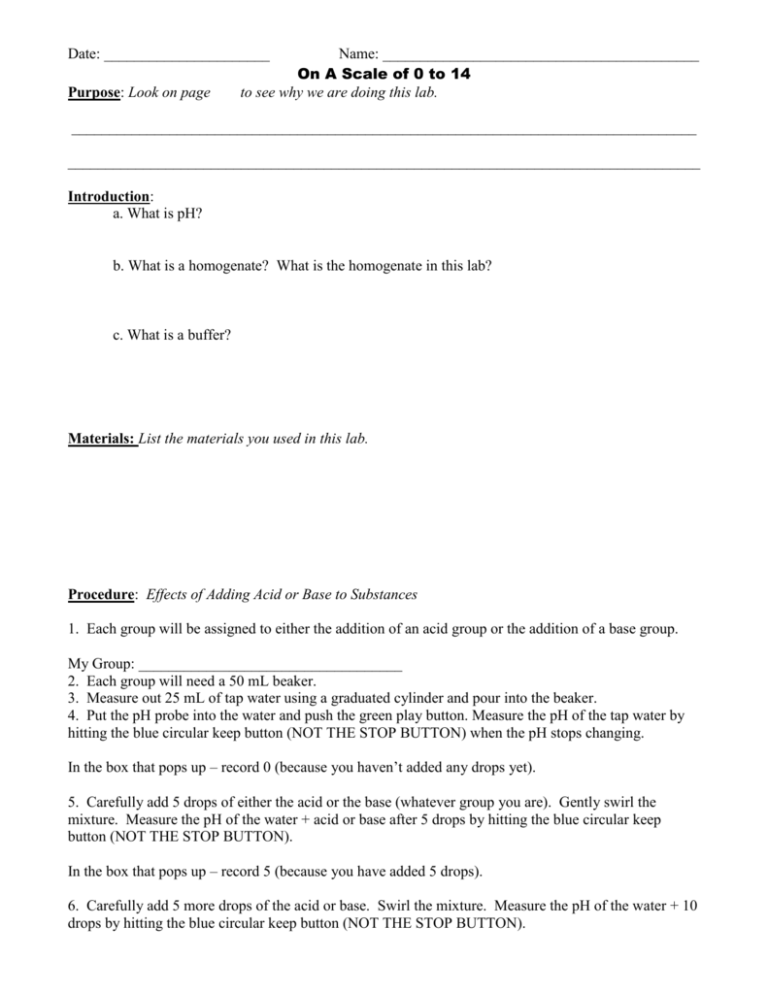
Date: ______________________ Purpose: Look on page Name: __________________________________________ On A Scale of 0 to 14 to see why we are doing this lab. ___________________________________________________________________________________ ____________________________________________________________________________________ Introduction: a. What is pH? b. What is a homogenate? What is the homogenate in this lab? c. What is a buffer? Materials: List the materials you used in this lab. Procedure: Effects of Adding Acid or Base to Substances 1. Each group will be assigned to either the addition of an acid group or the addition of a base group. My Group: ___________________________________ 2. Each group will need a 50 mL beaker. 3. Measure out 25 mL of tap water using a graduated cylinder and pour into the beaker. 4. Put the pH probe into the water and push the green play button. Measure the pH of the tap water by hitting the blue circular keep button (NOT THE STOP BUTTON) when the pH stops changing. In the box that pops up – record 0 (because you haven’t added any drops yet). 5. Carefully add 5 drops of either the acid or the base (whatever group you are). Gently swirl the mixture. Measure the pH of the water + acid or base after 5 drops by hitting the blue circular keep button (NOT THE STOP BUTTON). In the box that pops up – record 5 (because you have added 5 drops). 6. Carefully add 5 more drops of the acid or base. Swirl the mixture. Measure the pH of the water + 10 drops by hitting the blue circular keep button (NOT THE STOP BUTTON). 7. Continue this process of adding 5 drops at a time and measuring the pH after 5 drops until you reach 30 drops of the acid or base. After you reach 30 drops, you hit the red STOP button. Continuing with the potato homogenate. 8. Dump the contents of your beaker down the drain and rinse your beaker thoroughly. 9. Measure out 25 mL of potato homogenate using a graduated cylinder and pour into the beaker. 10. Put the pH probe into the potato juice and push the green play button. When the box pops up click on the STORE LATEST RUN button and hit the blue circular keep button (NOT THE STOP BUTTON) once the pH stops changing. In the box that pops up – record 0 (because you haven’t added any drops yet). 11. Follow the same instructions as above, adding 5 drops at a time and recording the pH by hitting the keep button. Only hit the stop button after you have reached 30 drops. Hypothesis: (What do you think is going to happen to the water and the potato as acid or base is added to them?) Remember the proper format for a hypothesis. ____________________________________________________________________________________ ____________________________________________________________________________________ Results/Data: Data table of Adding Acids & Bases to Water & Potato Homogenate In your lab group, only one side of this chart will be completed. We will exchange the results, so that the entire data table is completed. Solution 0 5 Tests with ACID Tests with BASE pH after this # of drops of Acid pH after this # of drops of Acid 10 15 20 25 30 0 5 10 15 20 25 Tap Water Potato Homogenate Analysis: Graph the results of the data table from Part B. Use the graph paper included. There should be 4 different lines on this line graph = WATER + ACID, WATER + BASE, POTATO + ACID, & POTATO + BASE. Be sure to include a key, so I know which line is which. Analysis Questions: Answer these on a separate sheet of paper and attach to the lab report. 1. Does the potato homogenate respond to the addition of acid and base in the same way or differently than the water responded. EXPLAIN. 2. Based on your results, do you think potato cells are buffered when compared with water (you may need to look in your book on page 107 to understand what a buffer is)? 3. Do you think all living things contain buffers? Why or why not? 30 4. At what pH do you think the inside of potato cells function best? Why? 5. How might a buffer help maintain homeostasis? 6. Some companies say that their products, like shampoo, are pH balanced or buffered. How could you test this claim? Graph – Part B

