LAB: Organisms and pH - Gleason
advertisement
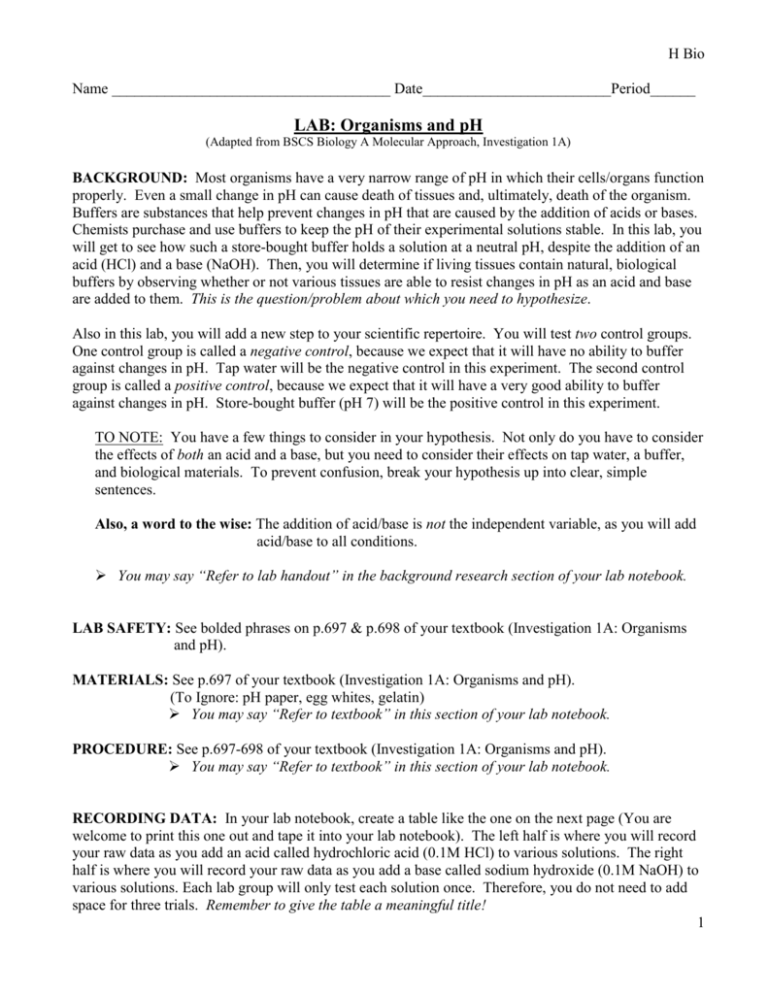
H Bio Name _____________________________________ Date_________________________Period______ LAB: Organisms and pH (Adapted from BSCS Biology A Molecular Approach, Investigation 1A) BACKGROUND: Most organisms have a very narrow range of pH in which their cells/organs function properly. Even a small change in pH can cause death of tissues and, ultimately, death of the organism. Buffers are substances that help prevent changes in pH that are caused by the addition of acids or bases. Chemists purchase and use buffers to keep the pH of their experimental solutions stable. In this lab, you will get to see how such a store-bought buffer holds a solution at a neutral pH, despite the addition of an acid (HCl) and a base (NaOH). Then, you will determine if living tissues contain natural, biological buffers by observing whether or not various tissues are able to resist changes in pH as an acid and base are added to them. This is the question/problem about which you need to hypothesize. Also in this lab, you will add a new step to your scientific repertoire. You will test two control groups. One control group is called a negative control, because we expect that it will have no ability to buffer against changes in pH. Tap water will be the negative control in this experiment. The second control group is called a positive control, because we expect that it will have a very good ability to buffer against changes in pH. Store-bought buffer (pH 7) will be the positive control in this experiment. TO NOTE: You have a few things to consider in your hypothesis. Not only do you have to consider the effects of both an acid and a base, but you need to consider their effects on tap water, a buffer, and biological materials. To prevent confusion, break your hypothesis up into clear, simple sentences. Also, a word to the wise: The addition of acid/base is not the independent variable, as you will add acid/base to all conditions. You may say “Refer to lab handout” in the background research section of your lab notebook. LAB SAFETY: See bolded phrases on p.697 & p.698 of your textbook (Investigation 1A: Organisms and pH). MATERIALS: See p.697 of your textbook (Investigation 1A: Organisms and pH). (To Ignore: pH paper, egg whites, gelatin) You may say “Refer to textbook” in this section of your lab notebook. PROCEDURE: See p.697-698 of your textbook (Investigation 1A: Organisms and pH). You may say “Refer to textbook” in this section of your lab notebook. RECORDING DATA: In your lab notebook, create a table like the one on the next page (You are welcome to print this one out and tape it into your lab notebook). The left half is where you will record your raw data as you add an acid called hydrochloric acid (0.1M HCl) to various solutions. The right half is where you will record your raw data as you add a base called sodium hydroxide (0.1M NaOH) to various solutions. Each lab group will only test each solution once. Therefore, you do not need to add space for three trials. Remember to give the table a meaningful title! 1 H Bio Tests with 0.1M HCl (ACID) Tests with 0.1M NaOH (BASE) pH after addition of pH after addition of SOLUTION TESTED 0 drops 5 drops 10 drops 20 drops 0 drops 5 drops 10 drops 20 drops Tap water pH 7 Buffer Homogenized cow liver Homogenized potato PROCESSING THE DATA: 1.) To process your data, you need to calculate the change in pH that occurred in each of the four solutions after the addition of 0, 5, 10, and 20 drops of acid and base. The addition of base should produce a change that is positive. For example, if tap water changed from an original pH of 6 to a pH of 8.1 after the addition of 10 drops of NaOH, the total change would be 2.1. (There are no units for pH.) Conversely, the addition of acid should produce a change that is negative. For example, if tap water changed from an original pH of 6 to a pH of 4.5 after the addition of 10 drops of HCl, the total change would be -1.5. (There are no units for pH.) 2.) Once you calculate the change in pH for each data point, you need to graph these data. Please graph your data by hand. In this case, DO NOT get a line of best fit. Simply connect the dots. Your graph should have the following information on each axis: X-axis: Number of drops of acid/base Y-axis: Change in pH *I know this breaks the rule of putting the independent variable on the X-axis. When plotting multiple lines on one graph, that rule no longer applies.* 3.) Your graph will have data points with both positive and negative values. As such, the value of zero (0) on the Y-axis should be placed in the middle of the Y-axis. See below for an example: 0 4.) For changes that occurred as a result of adding acid, use solid lines on your graph. For changes that occurred as a result of adding base, use dashed lines. Use different colors for each of the four solutions you tested. You will need to create a key. 2 H Bio DATA ANALYSIS QUESTIONS: Please type up answers (in complete sentences) to the questions below. 1.) Based on your data, did tap water appear to have any ability to prevent changes in pH? Make specific reference to the parts of your graph that support your answer. (2 points) 2.) Did the living tissue (liver and/or potato) appear to contain any natural, biological buffers? Make specific reference to the parts of your graph that support your answer. (2 points) 3.) Would biological buffers aid or hinder the maintenance of a relatively stable environment within a living cell? Based on your answer, what characteristic of life is made possible by the presence of biological buffers? (2 points) CONCLUSION: In paragraph format, type up a conclusion in which the following questions are answered. o Was your hypothesis supported or refuted? How do you know? Make specific references to your graph. (2 points) o What does this tell you about the problem/question you investigated? Relate your findings to what we are currently learning/have learned in class. (2 points) o Are your data valid? If yes, why? If no, why not? (4 points) o What would you do next to make your data valid OR what related question would you investigate next? (1 point) 3
