Biology
advertisement
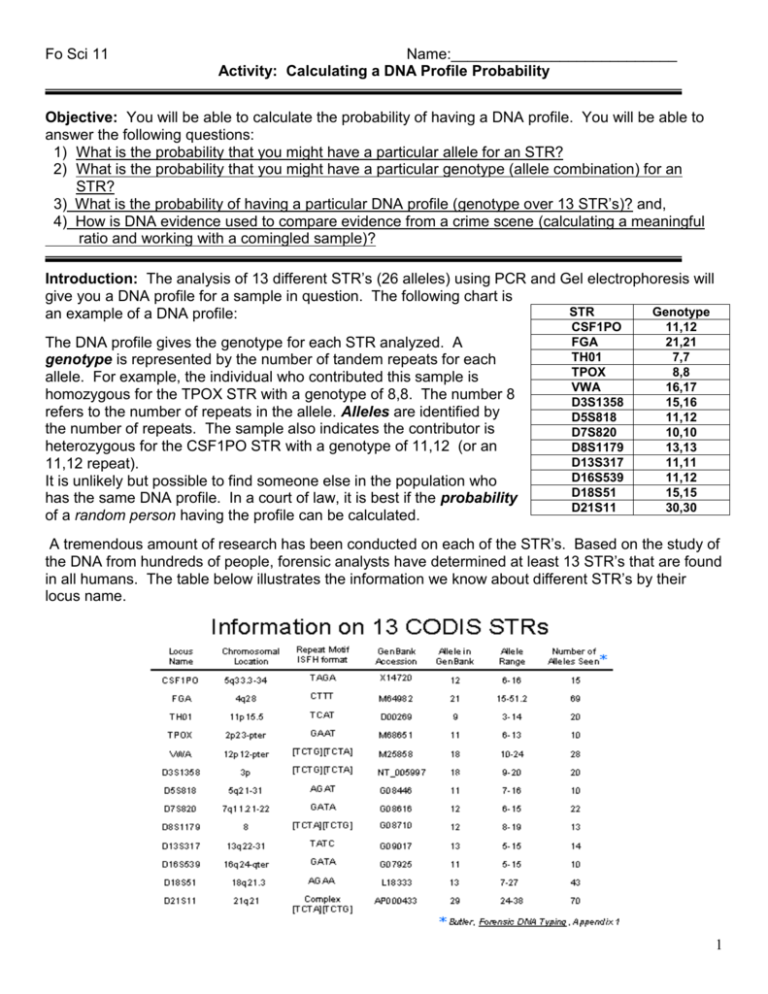
Fo Sci 11 Name:___________________________ Activity: Calculating a DNA Profile Probability Objective: You will be able to calculate the probability of having a DNA profile. You will be able to answer the following questions: 1) What is the probability that you might have a particular allele for an STR? 2) What is the probability that you might have a particular genotype (allele combination) for an STR? 3) What is the probability of having a particular DNA profile (genotype over 13 STR’s)? and, 4) How is DNA evidence used to compare evidence from a crime scene (calculating a meaningful ratio and working with a comingled sample)? Introduction: The analysis of 13 different STR’s (26 alleles) using PCR and Gel electrophoresis will give you a DNA profile for a sample in question. The following chart is STR Genotype an example of a DNA profile: The DNA profile gives the genotype for each STR analyzed. A genotype is represented by the number of tandem repeats for each allele. For example, the individual who contributed this sample is homozygous for the TPOX STR with a genotype of 8,8. The number 8 refers to the number of repeats in the allele. Alleles are identified by the number of repeats. The sample also indicates the contributor is heterozygous for the CSF1PO STR with a genotype of 11,12 (or an 11,12 repeat). It is unlikely but possible to find someone else in the population who has the same DNA profile. In a court of law, it is best if the probability of a random person having the profile can be calculated. CSF1PO FGA TH01 TPOX VWA D3S1358 D5S818 D7S820 D8S1179 D13S317 D16S539 D18S51 D21S11 11,12 21,21 7,7 8,8 16,17 15,16 11,12 10,10 13,13 11,11 11,12 15,15 30,30 A tremendous amount of research has been conducted on each of the STR’s. Based on the study of the DNA from hundreds of people, forensic analysts have determined at least 13 STR’s that are found in all humans. The table below illustrates the information we know about different STR’s by their locus name. 1 Objective #1 What is the probability that you might have a particular allele for a given STR? Additional studies using blood from blood banks, have determined the frequency or probability of having any single allele in the population. Refer to the article, “Allele Frequencies for 15 Autosomal STR Loci on U.S. Caucasian, African American, and Hispanic Populations.” by Butler et al., 2003. Butler et al. lists the frequencies of different STR alleles based on cultural background. »Use the charts in the Butler article to fill in the following frequencies and probabilities: Frequency or Probability (%) of Having the Allele: STR Allele Repeat CSF1PO 10 D5S818 13 Caucasian African American Hispanic »Why are these frequencies different? _________________________________________________ ________________________________________________________________________________ »Fill in the following chart for a Caucasian male for the THO1 STR: Allele or Repeat 6 7 8 9 10 Frequency or Probability (%) »Why are these frequencies different? ________________________________________________ ________________________________________________________________________________ »Which repeats would be most valuable in a DNA Profile? Explain ___________________________ ________________________________________________________________________________ »How many people in a group of 100 Caucasians might be likely to have a 6 repeat for their THO1 STR? ________________________ 2 Objective # 2 What is the probability that you might have a particular genotype (allele combination) for an STR? The results from a gel electrophoresis or capillary electrophoresis will give you the genotype for each STR. It is valuable to determine the probability of having a particular genotype (both alleles) for each STR. Probability Rule for Independent Events (aka. Multiplication Rule): The probability of two or more independent events occurring at the same time is the product of the individual probabilities. (ex. The probability of having a girl or boy is 50%. The probability of having 2 girls in a row— independent of each other--is .5 x .5 = 25%) »Fill in the frequencies for the alleles in the following chart for a sample contributed by a Hispanic female: STR Genotype FGA 21,21 CSF1PO 11,12 Frequency of the 1st allele Frequency of the 2nd allele Probability of the genotype (p2 or 2pq) »Calculate the probability of having either of the genotypes above. For the homozygous alleles use p2 where p is equal to the frequency of the 21 repeat allele. For the heterozygous alleles, use 2pq where p is equal to the frequency of the 11 allele and q is the frequency of the 12 allele. (*The reason you double the product and not just square it is because there are two possible outcomes, (11,12) and (12,11). I won’t ever ask that on a test!) »Will the probability of having two 21 alleles for an FGA be greater or less than having one allele? Why? ___________________________________________________________________________ ________________________________________________________________________________ Directions: Use the information given to answer the questions below.(Use Table 2 in Butler et al.) 1) What is the probability that an African American woman would have 9 repeats for the D5S818 STR?__________________ 2) What is the probability that that same woman would have 11 repeats? _________________ 3) What is the probability that the woman would be (9,9)? _____________________________ 4) What is the probability that she is (11,11)? _______________________________________ 5) What is the probability that she is (9,11)? ________________________________________ 6) If she is (9,11), out of 3000 people, how many would you expect to be the same? _________ 3 Objective # 3 What is the probability of having a particular DNA profile (genotype over 13 STR’s)? To determine how likely it is to have a set of 13 different genotypes, you use the Probability Rule (aka multiplication rule): The equation for determining the probability of having 13 different STR genotypes is: (P1) (P2) (P3) (P4) (P5) (P6) (P7) (P8) (P9) (P10) (P11) (P12) (P13) where P = the probability of having a particular genotype for a given STR. The final probability or Profile Probability, or Profile Frequency will result. The smaller the profile probability is, the less likely it will be to find some random person with the same DNA fingerprint and the more powerful your evidence will be. Problem: Fill out the following chart to determine the probability of a Hispanic female having the following DNA fingerprint. The first two have been done for you. STR Genotype Frequency of the 1st allele Frequency of the 2nd allele Probability of the genotype (p2 or 2pq) CSF1PO 11,12 0.293 0.357 2pq= 0.209202 FGA 21,21 0.168 0.168 p2=0.028224 TH01 7,7 TPOX 8,8 VWA 16,17 D3S1358 15,16 D5S818 11,12 D7S820 10,10 D8S1179 13,13 D13S317 11,11 D16S539 11,12 D18S51 15,15 D21S11 30,30 PROFILE PROBABILITY(Frequency) Your final answer will be so small that only one in 5 trillion people might have the same DNA profile. Since there are only 6.8 Billion people on the earth, the chance that some random person would have this profile is virtually impossible. This is the strength of DNA analysis and DNA profiling. 4 3) How is probability used to compare evidence at a crime scene? “On December 6, 1973, a young couple stumbled across the remains of a 15-year-old girl in McKenny Park, Washington. Kathy Devine was last seen by friends on November 25th hitchhiking from Seattle to Oregon, trying to run away from home. Shortly after she began her journey, pathologists said she met her death. Kathy Devine had been strangled, sodomized and her throat cut. Everybody believed that Kathy Devine was one of the many victims of serial killer, Ted Bundy. It took 28 years and DNA evidence to find the truth. “ “At the time of the murder, William E. Cosden Jr. had been living in the area and had been seen at the truck stop where he worked with blood on his clothes. Cosden had been released in 1973 from a mental hospital where he was confined after the 1967 murder of a woman.” At the time, evidence was collected but DNA analysis was not done. (From www.crimelibrary.com) Imagine that the following table includes samples of DNA from the victim and Cosden. They have undergone PCR and multiplexing to give the following genotypes. In all three cases, the individuals sampled were Caucasian. Sample Amelogenin Victim’s XX blood Blood on Cosden’s XX shirt D3S1358 14,15 VWA 18,20 FGA 24 D8S1179 13,16 14,15 18,20 24 13,16 D21S11 28, 30.2 28, 30.2 D18S51 14,15 14,15 The same information above is seen below in an imaginary gel electrophoresis result: AMEL D3 VWA FGA D8 D21 D18 Victim’s blood Blood on Shirt It seems that the blood on Cosden’s shirt is identical to the blood of the victim. Cosden was sentenced to 48 years and is not likely to go free again. How convinced are you of the results above? How likely is it that the blood on Cosden’s shirt came from some random person other than Devine? To determine this, calculate the profile probability for the sequences above. Show your work. Profile Probability: _______________________ 5 Important Points for Interpreting Profile Probabilities: The smaller the profile probability, the less likely it will be to find a random person with the same DNA profile. The smaller the profile probability, the better connection between evidence and suspect. Most profile probabilities are very difficult to understand. A jury that is presented with a profile probability of 3.2 x 10⁻²³ will find it difficult to understand (0.00000000000000000000032%). The number becomes virtually meaningless. The profile probability can be converted into a Meaningful Ratio to One. 1: 1 p where p is the profile probability Meaningful Ratio to One is defined as the number of people you would have to sample in order to find one with the same DNA profile. For our example, 1/(3.2 x 10-23) or 3.125 x 1024. Refer to “Million, Billion, Zillion” and you will see that this means only one out of 3 septillion people are likely to have this same DNA profile! Since there are only 6.8 billion people on earth, it is unlikely to find another random person with the same DNA profile. Co-mingled samples: Many times, fluids collected at a crime scene become mixed or co-mingled with other fluids. In this case, a DNA analysis can become quite confusing because it contains more than one persons DNA. Look at the following gel result and determine if the sample collected at the scene contains the fluids from suspect 1 or 2. Loci 1 2 3 4 5 6 7 victim’s DNA I I I I II III I II I II I I II III I I II II I II I II I I II I II I I I II I I sample collected suspect 1 suspect 2 8 In every case, the bands from the victim’s DNA will be found in the co-mingled sample collected at the crime scene. In order to determine which suspect’s DNA is in the sample, you need to look for a band in the sample that is NOT in the victim’s DNA. At loci 3, the sample contains a band that is not present in the victim’s DNA. It is present in suspect 2 but not in suspect 1. That tells you that suspect 2’s DNA is co-mingled with the victim’s DNA in the sample collected at the crime scene. Loci 6, 7 and 8 also support this conclusion. Explain why the sample could not have come from suspect 1 (you should discuss 5 STR’s in your answer): ____________________________________________________________________________ ____________________________________________________________________________ ____________________________________________________________________________ ____________________________________________________________________________ ____________________________________________________________________________ ____________________________________________________________________________ 6


