Chapter 6: Interest Rates - Rose
advertisement
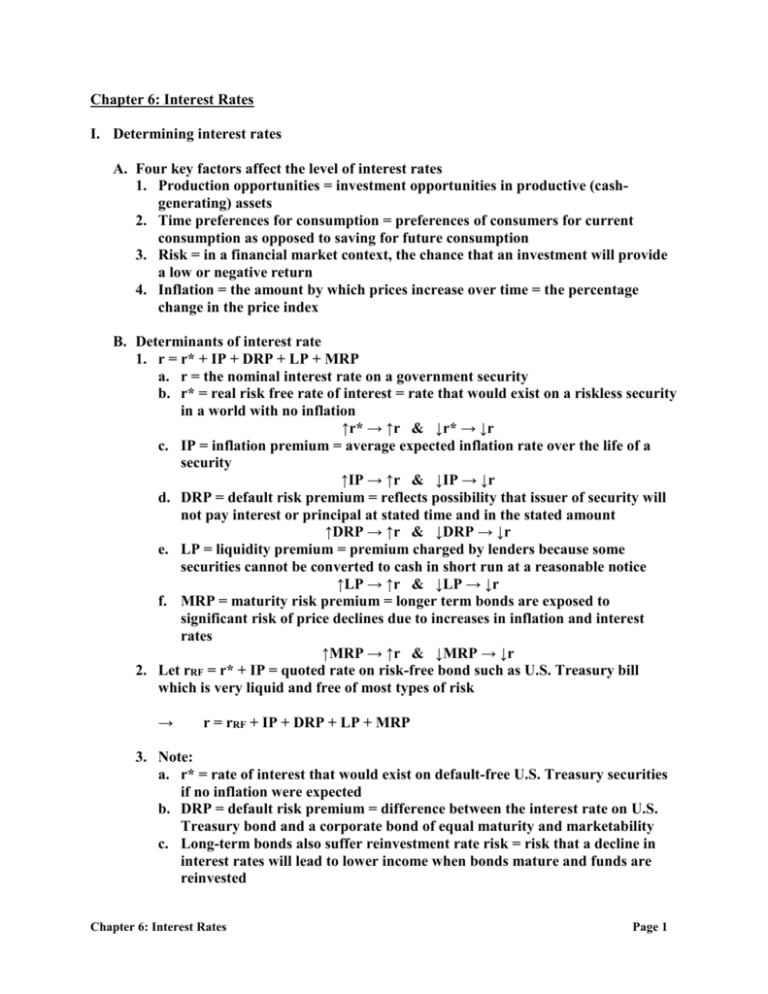
Chapter 6: Interest Rates I. Determining interest rates A. Four key factors affect the level of interest rates 1. Production opportunities = investment opportunities in productive (cashgenerating) assets 2. Time preferences for consumption = preferences of consumers for current consumption as opposed to saving for future consumption 3. Risk = in a financial market context, the chance that an investment will provide a low or negative return 4. Inflation = the amount by which prices increase over time = the percentage change in the price index B. Determinants of interest rate 1. r = r* + IP + DRP + LP + MRP a. r = the nominal interest rate on a government security b. r* = real risk free rate of interest = rate that would exist on a riskless security in a world with no inflation ↑r* → ↑r & ↓r* → ↓r c. IP = inflation premium = average expected inflation rate over the life of a security ↑IP → ↑r & ↓IP → ↓r d. DRP = default risk premium = reflects possibility that issuer of security will not pay interest or principal at stated time and in the stated amount ↑DRP → ↑r & ↓DRP → ↓r e. LP = liquidity premium = premium charged by lenders because some securities cannot be converted to cash in short run at a reasonable notice ↑LP → ↑r & ↓LP → ↓r f. MRP = maturity risk premium = longer term bonds are exposed to significant risk of price declines due to increases in inflation and interest rates ↑MRP → ↑r & ↓MRP → ↓r 2. Let rRF = r* + IP = quoted rate on risk-free bond such as U.S. Treasury bill which is very liquid and free of most types of risk → r = rRF + IP + DRP + LP + MRP 3. Note: a. r* = rate of interest that would exist on default-free U.S. Treasury securities if no inflation were expected b. DRP = default risk premium = difference between the interest rate on U.S. Treasury bond and a corporate bond of equal maturity and marketability c. Long-term bonds also suffer reinvestment rate risk = risk that a decline in interest rates will lead to lower income when bonds mature and funds are reinvested Chapter 6: Interest Rates Page 1 C. The loanable funds market 1. Two equations (the demand and supply for loanable funds) and two unknowns (the interest rate and the amount of money borrowed) 2. Curve describing borrowers’ behavior = supply of bonds = demand for loanable funds a. If the interest rate is on the vertical axis and the amount of funds demanded is on the horizontal axis, the demand for loanable funds is downward sloping b. Why? ↑ interest rate → ↑ cost of borrowing → ↓quantity of loanable funds demanded 3. Curve describing lenders’ behavior = demand for bonds = supply of loanable funds a. If the interest rate is on the vertical axis and the amount of funds demanded is on the horizontal axis, the supply of loanable funds is upward sloping b. Why? ↑ interest rate → ↑ return from lending → ↑quantity of loanable funds supplied 4. Why is the loanable funds market important? It determines the interest rate. a. The equilibrium interest rate is that interest rate where the demand and supply curve of loanable funds intersect b. If the current interest rate > equilibrium rate → excess supply of loanable funds → surplus of loanable funds → ↓ interest rate → move down the demand and supply of loanable funds to the equilibrium interest rate c. If the current interest rate < equilibrium rate → excess demand of loanable funds → shortage of loanable funds → ↑ interest rate → move up the demand and supply of loanable funds to the equilibrium interest rate 5. Shifts in the demand for loanable funds (will affect the equilibrium interest rate) a. ↑ attractiveness of investment opportunities → ↑ demand for loanable funds → the demand curve for loanable funds shifts to the right → at every interest rate, borrowers want to borrow more money b. ↑ government deficits → ↑ demand for loanable funds → the demand curve for loanable funds shifts to the right → at every interest rate, borrowers want to borrow more money c. ↑ expected inflation → ↑ demand for loanable funds → the demand curve for loanable funds shifts to the right → at every interest rate, borrowers want to borrow more money i. Consumers’ viewpoint: ↑ expected inflation → expect future prices to ↑ → borrow more now to buy cheaper product now ii. Producers’ viewpoint: ↑ expected inflation → expect future prices to ↑ → ↑profits if revenue grows faster than costs (costs constrained by long-term contracts) → ↑ attractiveness of investment opportunities → borrow more now to finance investment projects (new product, new physical capital, etc.) iii. Debtors’ viewpoint: ↑ expected inflation → expect future prices to ↑ → borrow more to pay back money worth less → borrow more now as the real cost of debt is cheaper Chapter 6: Interest Rates Page 2 6. Shifts in the supply of loanable funds (will affect the equilibrium interest rate) a. ↑ wealth → ↑ supply of loanable funds → supply curve for loanable funds shifts to the right → lenders will provide more money at every interest rate b. ↓ price level → money balances will now buy more goods and services → ↑ wealth → supply curve for loanable funds shifts to the right → lenders will provide more money at every interest rate c. ↓ relative risk of bonds → savers invest more money in the bond market → ↑ supply of loanable funds → supply curve for loanable funds shifts to the right → lenders will provide more money at every interest rate d. ↑ relative liquidity of bonds → savers invest more money in the bond market → ↑ supply of loanable funds → supply curve for loanable funds shifts to the right → lenders will provide more money at every interest rate e. ↑ relative expected return on bonds → savers invest more money in the bond market → ↑ supply of loanable funds → supply curve for loanable funds shifts to the right → lenders will provide more money at every interest rate f. ↓ expected inflation → savers will receive a higher real return on their investment in bonds → ↑ supply of loanable funds → supply curve for loanable funds shifts to the right → lenders will provide more money at every interest rate g. ↑ Money Supply → ↑ supply of loanable funds → supply curve for loanable funds shifts to the right → lenders will provide more money at every interest rate 7. Some exercises a. The effect of an increase in GDP i. Are interest rates procyclical or countercyclical? ii. Generally: ↑ GDP → ↑ interest rate b. Increase in government deficit: ↑ government deficit → ↑ interest rate c. ↑ in expected inflation → ↑ interest rate d. ↑ in the relative riskiness of stocks → ↓ interest rate e. ↑ in the expected relative return of bonds → ↓ interest rate III. Term structure of interest rates or “yield curve” A. Introduction 1. Term structure of interest rates or “yield curve” relates the interest rate to the time to maturity for securities with a common risk profile 2. Typically U.S. government securities used to construct yield curves: securities span wide range of securities and have no default risk 3. Could construct yield curve with corporate bonds with comparable risk 4. Yield curve shows cross-sectional data. Shows interest rates at any one instant. 5. What does slope of yield curve reveal? 6. Theories of term structure: a. The expectations theory b. Market segmentation theory c. Liquidity premium theory Chapter 6: Interest Rates Page 3 B. Expectations theory 1. Assumptions a. Market participants have no preference between short-run and long-run maturities. Different maturities are perfect substitutes. b. Investors risk neutral. Seek only highest expected return. c. Transactions cost of shifting between short-run and long-run securities is not relevant. d. People have expectations about future interest rates 2. Implications: a. Key result: Yield on security with N year maturity is the geometrically weighted average of current short-term rates and future expected short term rates b. Some (nasty) notation: trN = interest rate on N-year security in year t tr1 = interest rate on one-year security in year t t+1r1 = the implied one-year rate in year t + 1 t+2r1 = the implied one-year rate in year t + 2 t+ir1 = the implied one-year rate in year t + i (1+trN)N = (1+ tr1) (1+ t+1r1) (1+ t+2r1) (1+ t+3r1). . . (1+ t+Ni1) (1+ t rN )= (1+ t r1 )(1+ t+1r1 )(1+ t+2r1 )...(1+ t+Nr1 ) 1/N r = (1+ t r1 )(1+ t+1r1 )(1+ t+2r1 )...(1+ t+N r1 ) 1/N t N -1 c. Ex: Suppose we are interested in two periods, time t and time t + 1. Let tri = 8% and t+1ri = 12%. What is the interest rate on a current two-year security where consumer indifferent between buying a two-year security or successive one-year securities? (1+tr2)2 = (1+tr1) (1+t+1r1) (1+tr2)2=(1.08)(1.12)=1.2096 (1+tr2)=(1.2096)1/2=1.0998 tr2=10% i. If tr2>10% → two-year security gives more return than successive oneyear securities → increased demand for two-year securities → price of two-year security increases → return on two-year securities falls toward 10% ii. If tr2<10% → two-year security gives less return than successive one-year securities → decreased demand for two-year securities → price of twoyear security falls → return on two-year securities rises toward 10% Chapter 6: Interest Rates Page 4 d. Next result: According to this theory, expected holding period return is independent of security held. i. Assume an investor bought the two year security with tr2 = 10% at the beginning of year t. If investor sold asset at end of year t, will investor earn interest rate of 8% or 10%? ii. Person who buys the two-year security at beginning of time t+1 wants at least a 12% return. Why? Investor could buy 1-year security at time t=1 that pays 12%. Investor pays price on two-year security with 1 year left till maturity that ensures 12%. → initial investor selling 2-year security at end of time t, selling asset at capital loss → 8% return on 1-year holding period return 3. Different shapes of yield curve a. Positive slope: short-term interest rates expected to increase b. Negative slope: short-term interest rates expected to decrease c. Zero slope: short-term rates not expected to change 4. Advantages and disadvantages of theory a. Explains why interest rate on bonds of different maturity move together over time b. Flaw: yield curve usually slopes upward → short-term rates expected to increase. Problem: However, interest rates are just as likely to fall. C. Segmented market theory 1. Assumptions a. Extreme risk aversion b. Institutional restrictions i. Saving and loans have institutional factors which force them to operate in long-run market ii. Because of institutional structure of their liabilities, life insurance companies are concerned with long-term securities c. Investors reduce market risk by more closely matching securities maturity with planned holding period 2. Implications: a. Short-term and long-term interest rates are determined in relatively separate markets. b. term structure of interest rates simply reflects strength of demand and supply for loanable funds by maturity c. Interest rate of each bond is determined by supply and demand for that maturity bond with no effects from expected returns on other bonds 3. How does segmented market theory explain various slopes of yield curve? a. Upward sloping yield curve → demand for short-term bonds is relatively higher than demand for long-term bonds → short-term bonds have higher prices and lower return. Weaker demand in long-term market leads to lower prices and higher return for long-term bonds b. Downward sloping yield curve → Indicates demand for long-term bonds relatively stronger than demand for short-term bonds → higher prices and lower returns for long-term bonds Chapter 6: Interest Rates Page 5 4. Summary: a. Yield curve usually slopes upward → investors prefer to hold short-term bonds rather than long-term bonds b. Flaw: Segmented market theory ignores the empirical fact that interest rates on bonds of different maturities tend to move together D. The liquidity premium theory 1. Assumptions a. Investors wish to maximize return b. People risk averse. Don’t view short-term and long-term bonds as perfect substitutes. c. Short-term bonds less risky as they are more liquid (have active secondary market) and have little price fluctuation d. Long-term bonds perceived as more risky as investors have short-term time horizons e. Interest rate on long-term bonds must include liquidity premium to compensate for loss in liquidity 2. Main result: Interest rate on a long-term bond will equal average of short-term interest rates expected to occur over the life of long-term bond, plus liquidity premium (ρ) 1/N + ρ – 1 trN = [(1+tr1)(1+t+1r1). . .(1+t+Nr1)] 3. Explain various shapes of yield curve: a. Steep positive slope: expect future short-term rates to increase b. Modest positive slope: expect future short-term rates to remain constant. Positive slope due to liquidity premium. c. Flat line: Expect future short-term rates to moderately fall. Liquidity premium offsets expected fall in interest rates d. Steep negative slope: expect short-term rates to fall sharply 4. Summary a. Theory explains why interest rates on bonds with different maturities move together over time b. Theory explain usual positive slope → liquidity premium Chapter 6: Interest Rates Page 6
