Graphing Data
advertisement
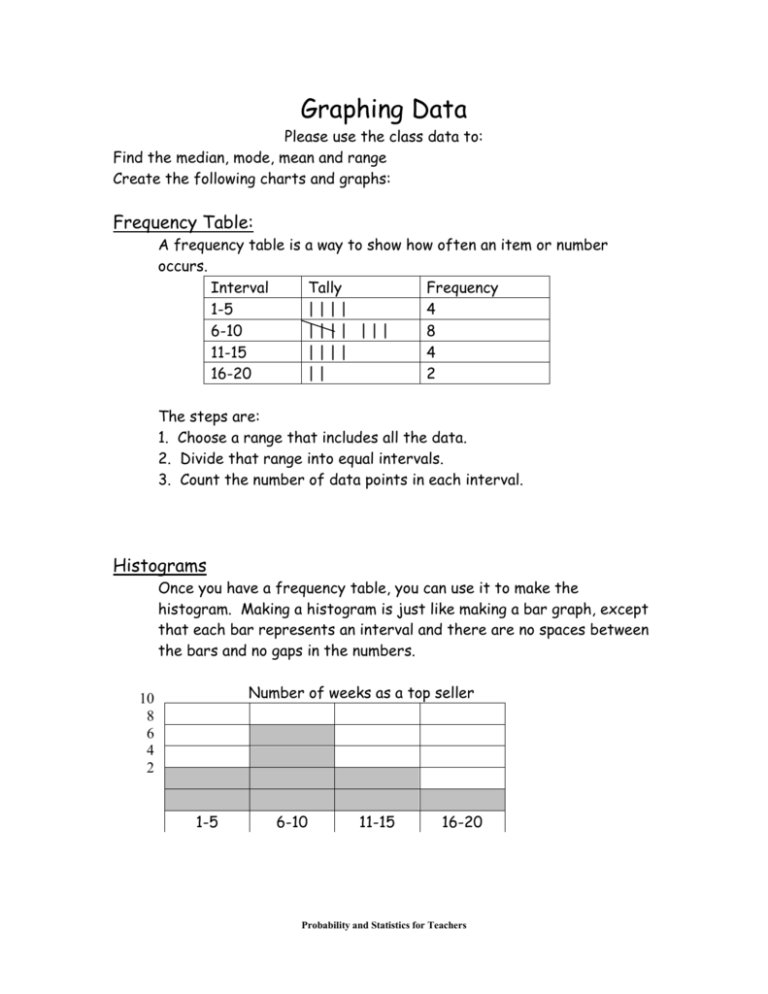
Graphing Data Please use the class data to: Find the median, mode, mean and range Create the following charts and graphs: Frequency Table: A frequency table is a way to show how often an item or number occurs. Interval Tally Frequency 1-5 |||| 4 6-10 |||| ||| 8 11-15 |||| 4 16-20 || 2 The steps are: 1. Choose a range that includes all the data. 2. Divide that range into equal intervals. 3. Count the number of data points in each interval. Histograms Once you have a frequency table, you can use it to make the histogram. Making a histogram is just like making a bar graph, except that each bar represents an interval and there are no spaces between the bars and no gaps in the numbers. Number of weeks as a top seller 10 8 6 4 2 1-5 6-10 11-15 16-20 Probability and Statistics for Teachers Stem and Leaf Plot To make a stem and leaf plot: 1. Title your lot. 2. Write the data in order from least to greatest. 3. Find the least and the greatest values. 4. Choose stem values that will include the extreme values. Write the tens vertically from least to greatest. Draw a vertical line to the right of the stem values. 6. Separate each number into stems (tens) and leaves (ones). Write each leaf to the right of its stem in order from least to greatest. 7. Write a key that explains how to read the stems and leaves. Stem Leaves 0 1, 3,4 ,5 ,6 ,6, 6, 7, 7, 8, 8, 9 1 1, 4, 5, 5, 7 2 0 Box and Whiskers Plot To make a box and whisker plot: 1. Write the data in order from least to greatest. 2. Draw a number line that can show the data in equal intervals. 3. Mark the median. 4. Mark the median of the upper half of the numbers (the upper quartile). 4. Mark the median of the lower half (the lower quartile). 6. Mark the upper extreme (the greatest number). 7. Mark the lower extreme (the lowest number). 8. Draw a box between the lower quartile and the upper quartile. Split the box by drawing a vertical line through the median. Draw two “whiskers” from the quartiles to the extremes. 12 13 14 Lower extreme Lower Quartile 15 16 Median 17 18 Upper Quartile Probability and Statistics for Teachers 19 20 Upper extreme


