IB Math SL Probability and Stats Definitions Review_with
advertisement
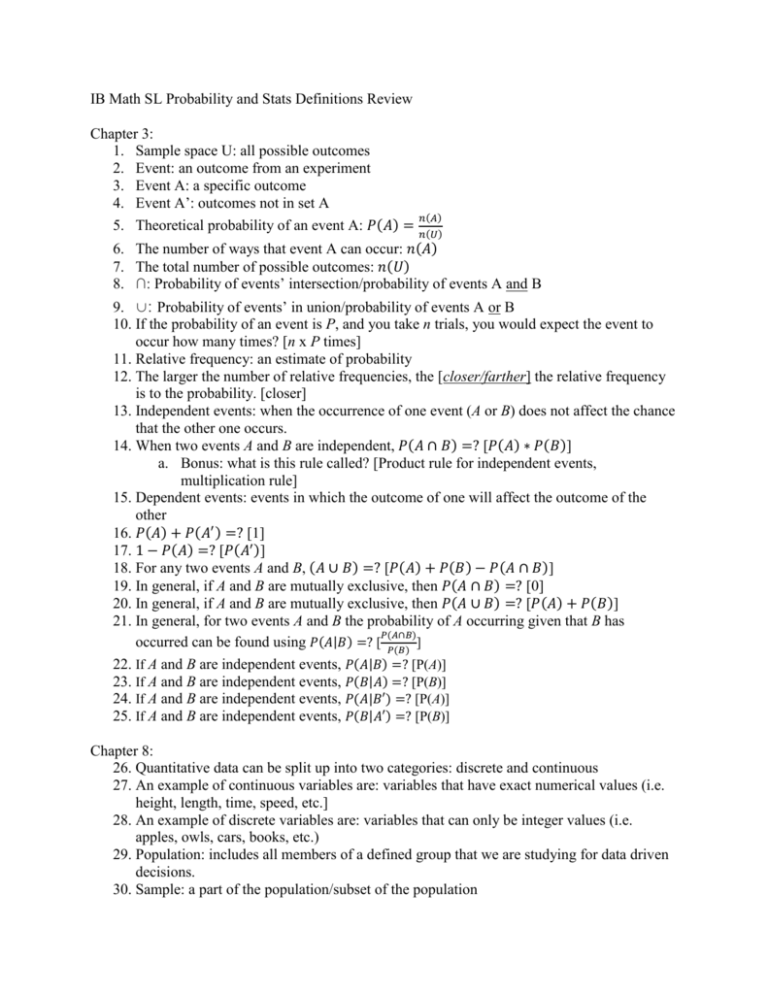
IB Math SL Probability and Stats Definitions Review Chapter 3: 1. Sample space U: all possible outcomes 2. Event: an outcome from an experiment 3. Event A: a specific outcome 4. Event A’: outcomes not in set A 𝑛(𝐴) 5. Theoretical probability of an event A: 𝑃(𝐴) = 𝑛(𝑈) 6. The number of ways that event A can occur: 𝑛(𝐴) 7. The total number of possible outcomes: 𝑛(𝑈) 8. ∩: Probability of events’ intersection/probability of events A and B 9. ∪: Probability of events’ in union/probability of events A or B 10. If the probability of an event is P, and you take n trials, you would expect the event to occur how many times? [n x P times] 11. Relative frequency: an estimate of probability 12. The larger the number of relative frequencies, the [closer/farther] the relative frequency is to the probability. [closer] 13. Independent events: when the occurrence of one event (A or B) does not affect the chance that the other one occurs. 14. When two events A and B are independent, 𝑃(𝐴 ∩ 𝐵) =? [𝑃(𝐴) ∗ 𝑃(𝐵)] a. Bonus: what is this rule called? [Product rule for independent events, multiplication rule] 15. Dependent events: events in which the outcome of one will affect the outcome of the other 16. 𝑃(𝐴) + 𝑃(𝐴′ ) =? [1] 17. 1 − 𝑃(𝐴) =? [𝑃(𝐴′ )] 18. For any two events A and B, (𝐴 ∪ 𝐵) =? [𝑃(𝐴) + 𝑃(𝐵) − 𝑃(𝐴 ∩ 𝐵)] 19. In general, if A and B are mutually exclusive, then 𝑃(𝐴 ∩ 𝐵) =? [0] 20. In general, if A and B are mutually exclusive, then 𝑃(𝐴 ∪ 𝐵) =? [𝑃(𝐴) + 𝑃(𝐵)] 21. In general, for two events A and B the probability of A occurring given that B has 𝑃(𝐴∩𝐵) occurred can be found using 𝑃(𝐴|𝐵) =? [ 𝑃(𝐵) ] 22. If A and B are independent events, 𝑃(𝐴|𝐵) =? [P(A)] 23. If A and B are independent events, 𝑃(𝐵|𝐴) =? [P(B)] 24. If A and B are independent events, 𝑃(𝐴|𝐵′) =? [P(A)] 25. If A and B are independent events, 𝑃(𝐵|𝐴′) =? [P(B)] Chapter 8: 26. Quantitative data can be split up into two categories: discrete and continuous 27. An example of continuous variables are: variables that have exact numerical values (i.e. height, length, time, speed, etc.] 28. An example of discrete variables are: variables that can only be integer values (i.e. apples, owls, cars, books, etc.) 29. Population: includes all members of a defined group that we are studying for data driven decisions. 30. Sample: a part of the population/subset of the population 31. How do we present continuous data? [Draw a histogram] 32. Mean: sum of the numbers divided by the number of values in a set of data 33. Mode: value that occurs most frequently in a set of data 34. Median: number present in the middle when the numbers in a set of data are arranged in order of size 35. Range: difference between the largest and smallest values 36. Outlier: an extreme value in a data set 37. Lower/First Quartile (Q1): median of the lower half of a data set; 25% of population are below this value 38. Median/Second Quartile (Q2): median of the entire set of data, is also called the 50th percentile; 50& of population are below this value 39. Third/Upper Quartile (Q3): median of the upper half of a data set; 75% of population are below this value 40. Interquartile Range (IQR): difference between the thir and first quartiles 41. Box and whisker plot: type of graph that shows the dispersion of data, including the five number summary


