Date - Lincoln Park Elementary School
Name: __________________
Date: __________
1.
Tuesday Homework
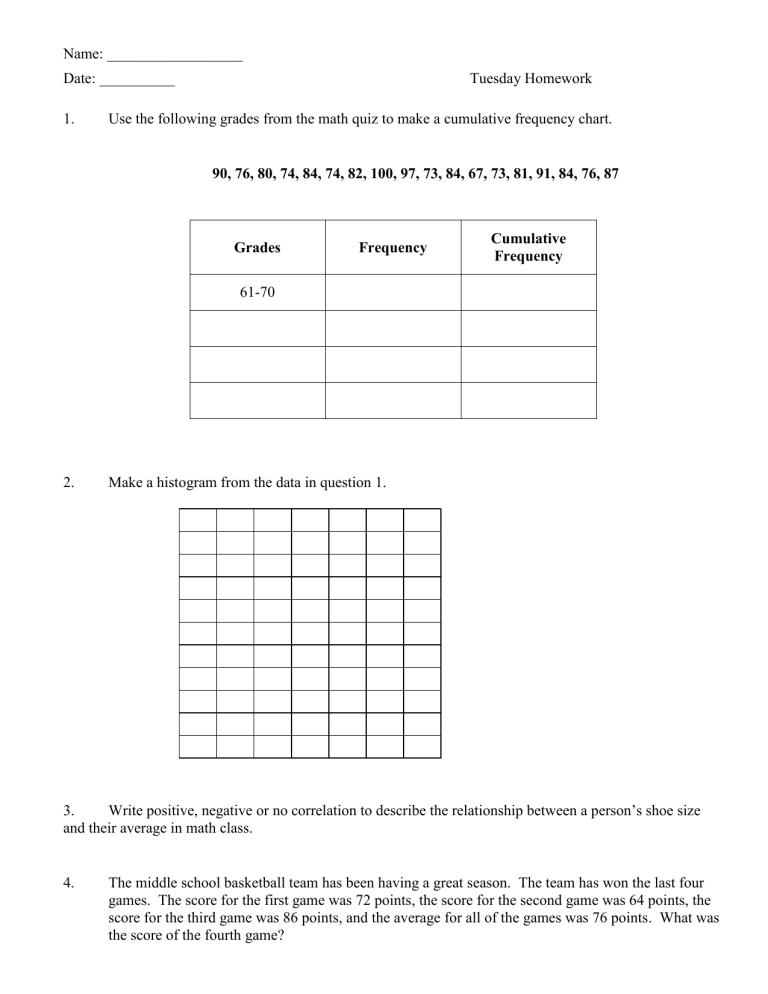
Use the following grades from the math quiz to make a cumulative frequency chart.
90, 76, 80, 74, 84, 74, 82, 100, 97, 73, 84, 67, 73, 81, 91, 84, 76, 87
Grades
61-70
Frequency
Cumulative
Frequency
2. Make a histogram from the data in question 1.
3. Write positive, negative or no correlation to describe the relationship between a person’s shoe size and their average in math class.
4. The middle school basketball team has been having a great season. The team has won the last four games. The score for the first game was 72 points, the score for the second game was 64 points, the score for the third game was 86 points, and the average for all of the games was 76 points. What was the score of the fourth game?
5. Use the box-and-whisker plot below to find the value of the following terms.
10 27 40 48 82
Median =________ Lower Extreme =________
Lower Quartile =________
Upper Extreme =________
Upper Quartile =________
6. Find the mean, median, mode and range of the following set of data:
43, 36, 50, 43, 41, 43, 30, 34, 30 and 48
Mean = ______ MAD = ________ Median = ______ Mode = ______ Range = ______
7. Use the following numbers to make a stem and leaf plot:
43, 36, 40, 50, 43, 30, 34, 30, 48, 30, 43, 41, and 50
Key:


