Chapter 3 Study Guide
advertisement
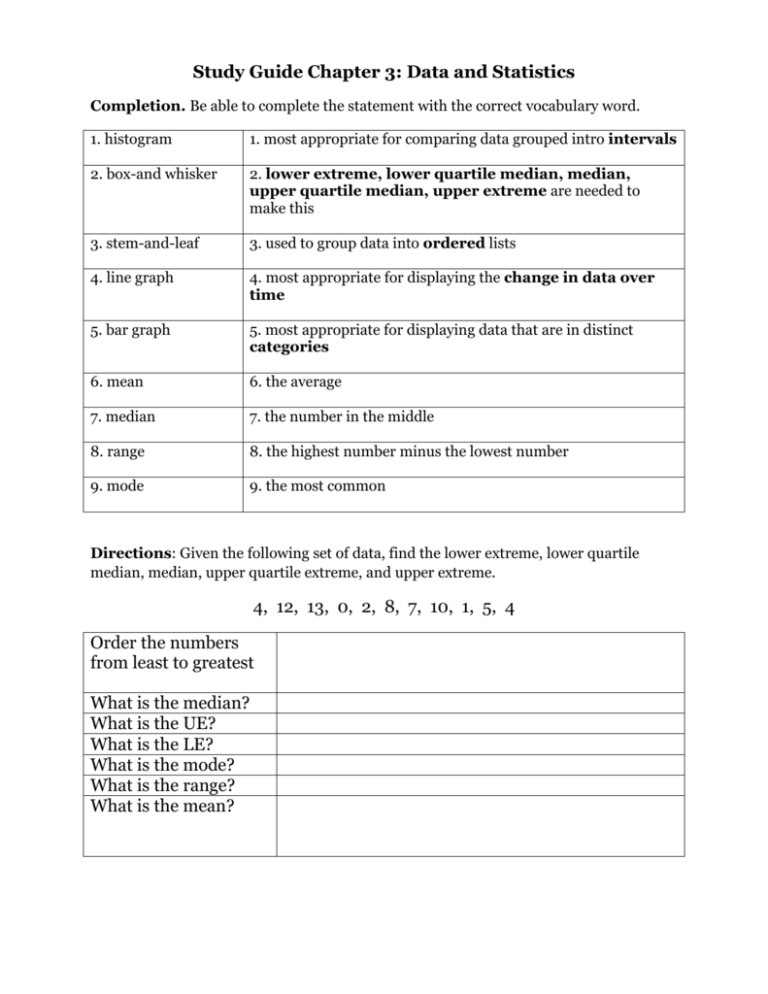
Study Guide Chapter 3: Data and Statistics Completion. Be able to complete the statement with the correct vocabulary word. 1. histogram 1. most appropriate for comparing data grouped intro intervals 2. box-and whisker 2. lower extreme, lower quartile median, median, upper quartile median, upper extreme are needed to make this 3. stem-and-leaf 3. used to group data into ordered lists 4. line graph 4. most appropriate for displaying the change in data over time 5. bar graph 5. most appropriate for displaying data that are in distinct categories 6. mean 6. the average 7. median 7. the number in the middle 8. range 8. the highest number minus the lowest number 9. mode 9. the most common Directions: Given the following set of data, find the lower extreme, lower quartile median, median, upper quartile extreme, and upper extreme. 4, 12, 13, 0, 2, 8, 7, 10, 1, 5, 4 Order the numbers from least to greatest What is the median? What is the UE? What is the LE? What is the mode? What is the range? What is the mean? Which is an example of an ORDERED stem-and-leaf plot: Create a histogram using the frequency table: Make a conclusion based upon the line graph: Bonus: what are the three main differences between a bar graph and histogram?


