LAB02 - CUNY.edu
advertisement

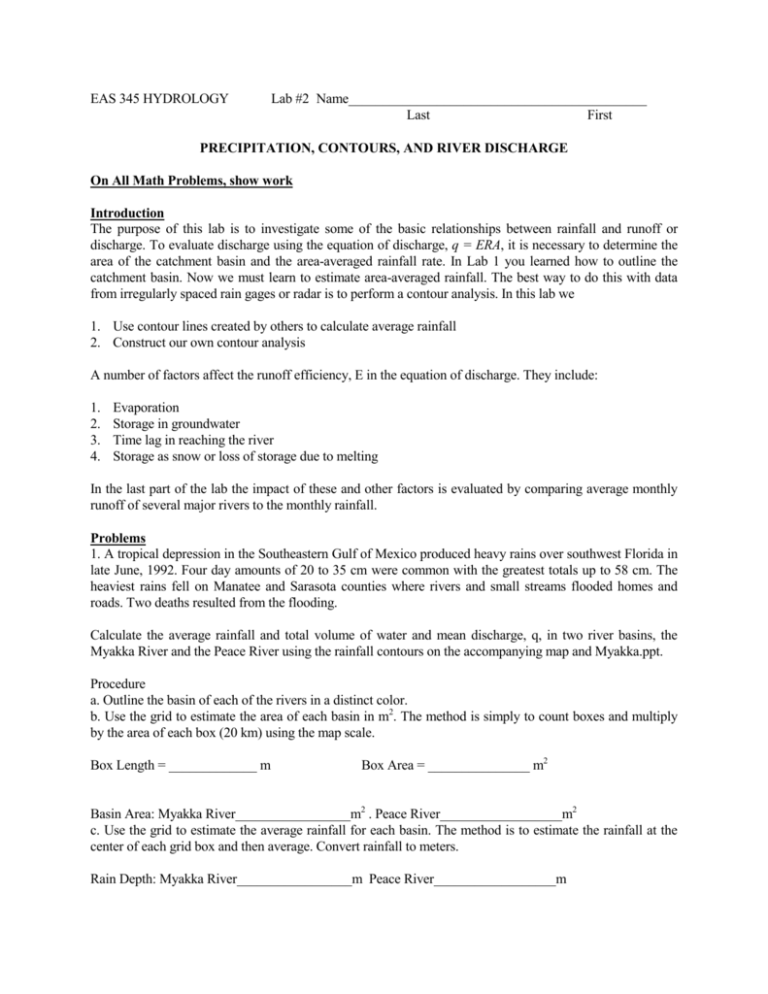
EAS 345 HYDROLOGY Lab #2 Name____________________________________________ Last First PRECIPITATION, CONTOURS, AND RIVER DISCHARGE On All Math Problems, show work Introduction The purpose of this lab is to investigate some of the basic relationships between rainfall and runoff or discharge. To evaluate discharge using the equation of discharge, q = ERA, it is necessary to determine the area of the catchment basin and the area-averaged rainfall rate. In Lab 1 you learned how to outline the catchment basin. Now we must learn to estimate area-averaged rainfall. The best way to do this with data from irregularly spaced rain gages or radar is to perform a contour analysis. In this lab we 1. Use contour lines created by others to calculate average rainfall 2. Construct our own contour analysis A number of factors affect the runoff efficiency, E in the equation of discharge. They include: 1. 2. 3. 4. Evaporation Storage in groundwater Time lag in reaching the river Storage as snow or loss of storage due to melting In the last part of the lab the impact of these and other factors is evaluated by comparing average monthly runoff of several major rivers to the monthly rainfall. Problems 1. A tropical depression in the Southeastern Gulf of Mexico produced heavy rains over southwest Florida in late June, 1992. Four day amounts of 20 to 35 cm were common with the greatest totals up to 58 cm. The heaviest rains fell on Manatee and Sarasota counties where rivers and small streams flooded homes and roads. Two deaths resulted from the flooding. Calculate the average rainfall and total volume of water and mean discharge, q, in two river basins, the Myakka River and the Peace River using the rainfall contours on the accompanying map and Myakka.ppt. Procedure a. Outline the basin of each of the rivers in a distinct color. b. Use the grid to estimate the area of each basin in m2. The method is simply to count boxes and multiply by the area of each box (20 km) using the map scale. Box Length = _____________ m Box Area = _______________ m2 Basin Area: Myakka River_________________m2 . Peace River__________________m2 c. Use the grid to estimate the average rainfall for each basin. The method is to estimate the rainfall at the center of each grid box and then average. Convert rainfall to meters. Rain Depth: Myakka River_________________m Peace River__________________m d. Calculate the total volume of water assuming a four day period that must flow through the mouth of each river during the time period assuming all rain reaches the rivers. Then calculate the discharge, q in m3 s-1. Total Volume: Myakka River_________________m3 Peace River__________________m3 qMyakka_________________m3 s-1 qPeace________________m3 s-1 2. To show the value of contouring, A: Calculate the station average rainfall based on the grid below. B: Contour the rainfall using an interval of 5. C: In each box enter values of rainfall you expect in each box based on your contour analysis. D: Calculate the area average rainfall using the values in every box A: Station Average = ________________ D: Area Average = ___________________ 3. Contour the values in the grid on page 4 using a contour interval = 20. 4. Rainfalls and discharges for 4 river basins (Niger, Tiber, Delaware, Yenesei) are included on the last page of this lab. a. Use EXCEL or MATLAB to graph the monthly average rainfall and average discharge for each river. b. For the Niger and Delaware Rivers, find the lag in months at which the maximum correlation between runoff, q and rainfall, R occurs and the correlation coefficient. Give the reason the maximum correlation is larger for the Niger than for the Delaware River. Reason = ______________________________________________________________________________ 15 20 25 30 35 MYAKKA 45 50 55 40 PEACE 18 18 18 19 19 19 19 18 18 18 17 17 17 16 15 15 14 13 13 12 35 35 35 35 35 34 34 33 32 31 30 28 27 25 23 22 20 18 16 14 51 51 51 50 50 49 48 46 45 43 41 39 36 34 31 28 25 22 19 16 65 65 65 64 63 62 60 58 56 54 51 48 45 41 38 34 30 26 22 18 78 77 77 76 75 73 71 69 66 63 60 56 52 48 43 39 34 29 24 19 87 87 86 85 84 82 80 77 74 70 66 62 58 53 48 43 37 31 26 20 94 94 93 92 90 88 86 83 79 75 71 66 61 56 51 45 39 33 27 20 98 98 97 96 94 92 89 86 82 78 74 69 63 58 52 46 40 33 27 20 99 98 98 96 94 92 89 86 82 78 74 69 63 58 52 46 39 33 26 19 96 96 95 94 92 90 87 84 80 76 72 67 61 56 50 44 38 31 25 18 90 90 89 88 86 84 82 79 75 71 67 62 57 52 47 41 35 29 23 16 81 81 80 79 78 76 74 71 68 64 60 56 52 47 42 37 31 25 20 14 70 69 69 68 67 65 63 61 58 55 52 48 44 40 35 31 26 21 16 11 55 55 55 54 53 52 50 48 46 44 41 38 35 31 28 24 20 16 12 8 39 39 39 38 38 37 36 34 33 31 29 27 24 22 19 16 13 10 7 4 21 21 21 21 21 20 20 19 18 17 16 14 13 11 9 8 6 4 2 0 2 2 2 3 3 3 3 2 2 2 1 1 1 0 -1 -1 -2 -3 -3 -4 -18 -18 -17 -17 -16 -16 -15 -15 -14 -14 -13 -13 -12 -12 -11 -11 -10 -10 -9 -9 -38 -37 -36 -36 -35 -34 -33 -31 -30 -29 -27 -26 -25 -23 -21 -20 -18 -16 -15 -13 -57 -56 -55 -54 -53 -51 -50 -48 -46 -44 -42 -39 -37 -34 -31 -29 -26 -23 -20 -17 -75 -74 -73 -71 -70 -68 -66 -63 -61 -58 -55 -52 -48 -45 -41 -37 -33 -29 -25 -21 -91 -90 -89 -87 -85 -83 -80 -77 -74 -71 -67 -63 -59 -54 -50 -45 -40 -35 -30 -25 -106 -104 -103 -101 -99 -96 -93 -90 -86 -82 -78 -73 -68 -63 -57 -52 -46 -40 -34 -28 -117 -116 -114 -112 -110 -107 -104 -100 -96 -91 -86 -81 -76 -70 -64 -58 -51 -44 -38 -31 -126 -125 -123 -121 -118 -115 -112 -108 -103 -98 -93 -87 -81 -75 -69 -62 -55 -48 -41 -33 -132 -131 -129 -127 -124 -121 -117 -113 -108 -103 -98 -92 -85 -79 -72 -65 -58 -50 -43 -35 -135 -133 -132 -129 -126 -123 -119 -115 -110 -105 -100 -94 -87 -81 -74 -67 -59 -52 -44 -36 -134 -133 -131 -129 -126 -123 -119 -115 -110 -105 -100 -94 -87 -81 -74 -67 -60 -52 -45 -37 -130 -129 -127 -125 -122 -119 -116 -112 -107 -102 -97 -91 -85 -79 -73 -66 -59 -52 -45 -37 -123 -122 -120 -118 -116 -113 -110 -106 -102 -97 -92 -87 -82 -76 -70 -64 -57 -50 -44 -37 Rainfall and Discharge for Several Rivers Around the World Niger River at Koulikoro (K), Mopti-Nanta Ka (M) and Dire (D). Rain at Kayes (Y) and Timbuktu (T) Jan Feb Mar Apr May Jun July Aug Sep Oct Nov Dec R(Y) 0.1 0 0 0 1.0 3.8 6.3 9.5 7.4 1.7 0 0 q(K) 403 196 101 67 98 359 1250 3230 5380 4680 2130 880 q(M) 992 400 185 130 82 194 708 1760 2580 2840 2690 2000 R(T) 0 0 0 0 .1 .8 2.3 3.2 1.4 .1 0 0 q(D) 2030 1550 967 434 141 82 259 841 1490 1890 2150 2300 Jan Feb Mar Apr May Jun July Aug Sep Oct Nov Dec R 2.7 2.3 1.5 1.7 2.0 1.0 0.6 0.9 2.7 3.7 3.8 2.8 q 301 343 325 272 242 168 137 123 134 177 264 234 Jan Feb Mar Apr May Jun July Aug Sep Oct Nov Dec R 2.6 2.2 2.9 3.0 3.7 3.6 3.6 3.2 2.6 3.1 2.7 2.6 q 351 353 611 653 387 235 197 170 157 179 292 334 Tiber River at Rome Delaware River, NJ Yenesei River Igarka Precipitation at Irkutsk Jan Feb Mar Apr May Jun July Aug Sep Oct Nov Dec R 0.4 0.3 0.3 0.2 1.5 2.2 3.5 3.1 1.7 0.7 0.7 0.6 q 4840 4510 4190 3980 30200 76000 27900 18900 17900 14700 6120 4880 Internet Source for World River Discharges http://www.rivdis.sr.unh.edu/


