single factor designs
advertisement
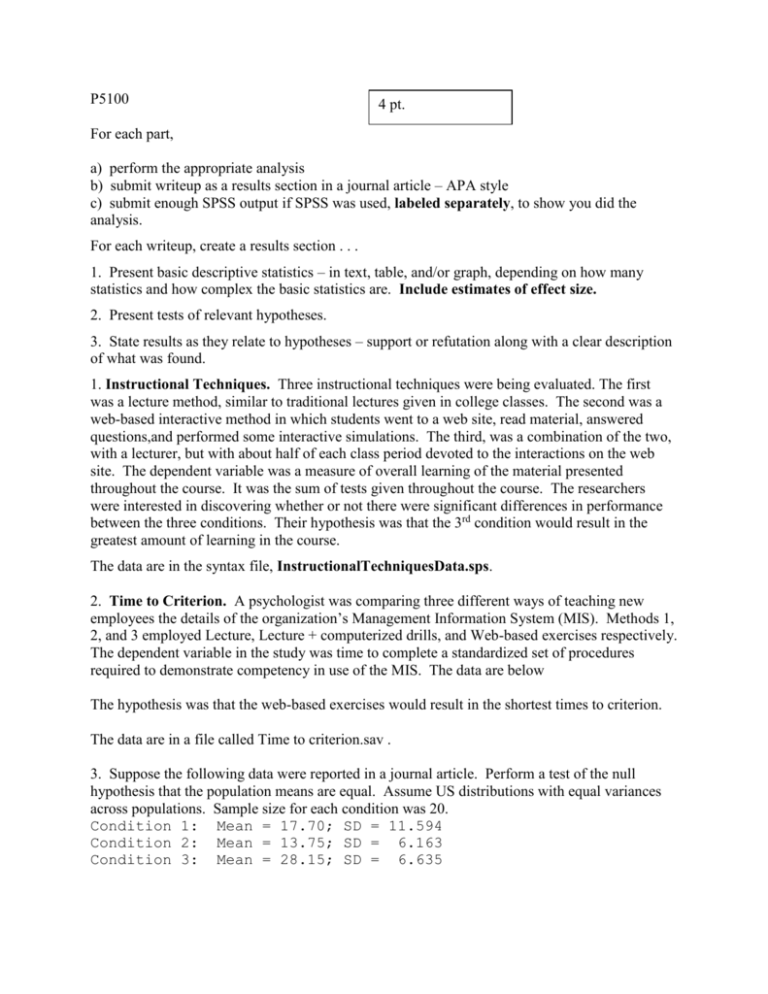
P5100 4 pt. For each part, a) perform the appropriate analysis b) submit writeup as a results section in a journal article – APA style c) submit enough SPSS output if SPSS was used, labeled separately, to show you did the analysis. For each writeup, create a results section . . . 1. Present basic descriptive statistics – in text, table, and/or graph, depending on how many statistics and how complex the basic statistics are. Include estimates of effect size. 2. Present tests of relevant hypotheses. 3. State results as they relate to hypotheses – support or refutation along with a clear description of what was found. 1. Instructional Techniques. Three instructional techniques were being evaluated. The first was a lecture method, similar to traditional lectures given in college classes. The second was a web-based interactive method in which students went to a web site, read material, answered questions,and performed some interactive simulations. The third, was a combination of the two, with a lecturer, but with about half of each class period devoted to the interactions on the web site. The dependent variable was a measure of overall learning of the material presented throughout the course. It was the sum of tests given throughout the course. The researchers were interested in discovering whether or not there were significant differences in performance between the three conditions. Their hypothesis was that the 3rd condition would result in the greatest amount of learning in the course. The data are in the syntax file, InstructionalTechniquesData.sps. 2. Time to Criterion. A psychologist was comparing three different ways of teaching new employees the details of the organization’s Management Information System (MIS). Methods 1, 2, and 3 employed Lecture, Lecture + computerized drills, and Web-based exercises respectively. The dependent variable in the study was time to complete a standardized set of procedures required to demonstrate competency in use of the MIS. The data are below The hypothesis was that the web-based exercises would result in the shortest times to criterion. The data are in a file called Time to criterion.sav . 3. Suppose the following data were reported in a journal article. Perform a test of the null hypothesis that the population means are equal. Assume US distributions with equal variances across populations. Sample size for each condition was 20. Condition 1: Mean = 17.70; SD = 11.594 Condition 2: Mean = 13.75; SD = 6.163 Condition 3: Mean = 28.15; SD = 6.635
