years, with sample standard deviation
advertisement
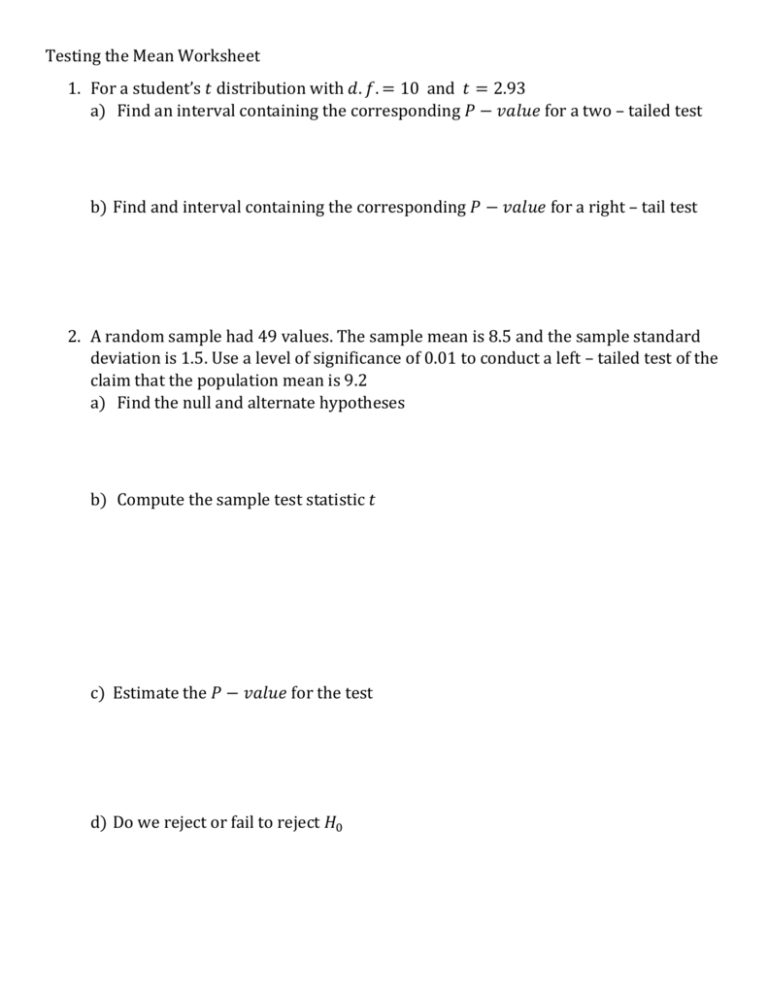
Testing the Mean Worksheet 1. For a student’s 𝑡 distribution with 𝑑. 𝑓. = 10 and 𝑡 = 2.93 a) Find an interval containing the corresponding 𝑃 − 𝑣𝑎𝑙𝑢𝑒 for a two – tailed test b) Find and interval containing the corresponding 𝑃 − 𝑣𝑎𝑙𝑢𝑒 for a right – tail test 2. A random sample had 49 values. The sample mean is 8.5 and the sample standard deviation is 1.5. Use a level of significance of 0.01 to conduct a left – tailed test of the claim that the population mean is 9.2 a) Find the null and alternate hypotheses b) Compute the sample test statistic 𝑡 c) Estimate the 𝑃 − 𝑣𝑎𝑙𝑢𝑒 for the test d) Do we reject or fail to reject 𝐻0 3. Let 𝑥 be a random variable that represents the pH of arterial plasma. For healthy adults, the mean of the 𝑥 distribution is 𝜇 = 7.4. A new drug for arthritis has been developed. However, it is thought that this drug may change blood pH. A random sample of 31 patients with arthritis took the drug for 3 months. Blood tests showed that 𝑥̅ = 8.1 with sample standard deviation 𝑠 = 1.9 . Use a 5% level of significance to test the claim that the drug has changed ( either way ) the mean pH level of blood. 4. A random sample of 46 adult coyotes in a region of northern Minnesota showed the average age to be 𝑥̅ = 2.05 years, with sample standard deviation 𝑠 = 0.82 years. It is thought that the overall population mean age of coyotes is 𝜇 = 1.75 years. Do the sample data indicate that coyotes in this region of northern Minnesota tend to live longer than the average of 1.75 years ? Use 𝛼 = 0.01 5. USA Today reported that the state with the longest mean life span is Hawaii, where the population mean life span is 77 years. A random sample of 20 obituary notices in the Honolulu Advertizer gave the following data : 𝑥̅ = 71.4 years , 𝑠 = 20.65 years. Assuming that life span in Honolulu is approximately normally distributed, does this information indicate that the population mean life span for Honolulu residents is less than 77 years ? Use a level of significance of 5%. 6. The ski patrol at Vail, Colorado is studying a common type of avalanche called a slab avalanche. Slab avalanches in Canada have an average thickness of 𝜇 = 67 cm. A random sample of avalanches in spring gave the following thicknesses ( in cm ) : 59 68 51 55 76 64 38 67 65 63 54 74 49 65 62 79 a) Find 𝑥̅ and 𝑠 using a calculator. 𝑥̅ = __________ 𝑠 = __________ b) Assume the slab thickness has an approximately normal distribution. Use a 1% level of significance to test the claim that the mean slab thickness in the Vail region is different from that in Canada.
