ddi12361-sup-0001-TableS1
advertisement
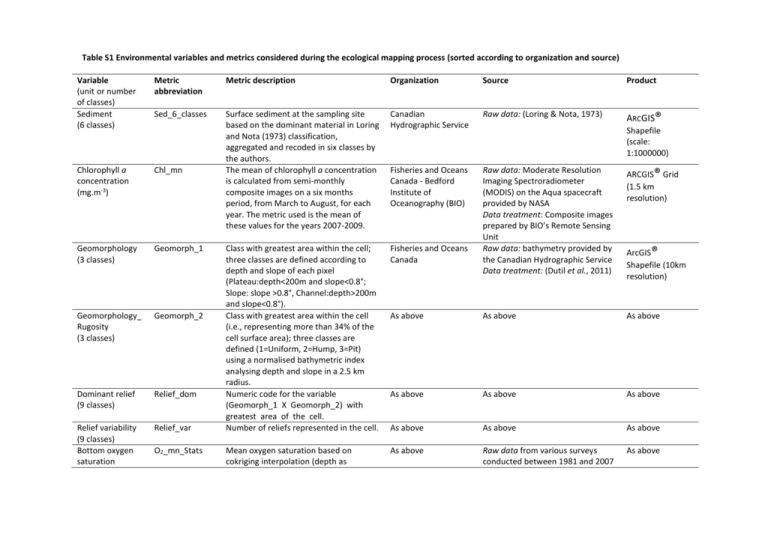
Table S1 Environmental variables and metrics considered during the ecological mapping process (sorted according to organization and source) Variable (unit or number of classes) Sediment (6 classes) Metric abbreviation Metric description Organization Source Product Sed_6_classes Canadian Hydrographic Service Raw data: (Loring & Nota, 1973) ARCGIS® Chlorophyll a concentration (mg.m-3) Chl_mn Surface sediment at the sampling site based on the dominant material in Loring and Nota (1973) classification, aggregated and recoded in six classes by the authors. The mean of chlorophyll a concentration is calculated from semi-monthly composite images on a six months period, from March to August, for each year. The metric used is the mean of these values for the years 2007-2009. Fisheries and Oceans Canada - Bedford Institute of Oceanography (BIO) ARCGIS® Grid (1.5 km resolution) Geomorphology (3 classes) Geomorph_1 Fisheries and Oceans Canada Geomorphology_ Rugosity (3 classes) Geomorph_2 As above As above As above Dominant relief (9 classes) Relief_dom As above As above As above Relief variability (9 classes) Bottom oxygen saturation Relief_var Class with greatest area within the cell; three classes are defined according to depth and slope of each pixel (Plateau:depth<200m and slope<0.8°; Slope: slope >0.8°, Channel:depth>200m and slope<0.8°). Class with greatest area within the cell (i.e., representing more than 34% of the cell surface area); three classes are defined (1=Uniform, 2=Hump, 3=Pit) using a normalised bathymetric index analysing depth and slope in a 2.5 km radius. Numeric code for the variable (Geomorph_1 X Geomorph_2) with greatest area of the cell. Number of reliefs represented in the cell. Raw data: Moderate Resolution Imaging Spectroradiometer (MODIS) on the Aqua spacecraft provided by NASA Data treatment: Composite images prepared by BIO’s Remote Sensing Unit Raw data: bathymetry provided by the Canadian Hydrographic Service Data treatment: (Dutil et al., 2011) As above As above As above Mean oxygen saturation based on cokriging interpolation (depth as As above Raw data from various surveys conducted between 1981 and 2007 As above O2_mn_Stats Shapefile (scale: 1:1000000) ArcGIS® Shapefile (10km resolution) (%) Bottom temperature (°C) Bottom salinity S_mn_Stats S_min_Stats S_max_Stats Sediment (69 classes) Sed_69_classes Bottom dissolved oxygen (10−3 mol.m-3) Depth (m) O2_Survey covariable). Three metrics corresponding to the depth class of the cell: - mean annual temperature - monthly minimal temperature - monthly maximal temperature. Three metrics corresponding to the depth class of the cell: - mean annual salinity - monthly minimal salinity - monthly maximal salinity. Surface sediment based on the dominant material in Loring and Nota (1973) classification, recoded in 69 classes. Value at the site at the date of sampling. Depth Depth at sampling site. T_mn_Stats T_min_Stats T_max_Stats As above As above As above As above In situ measurement Annual trawl survey In situ measurement The GEBCO_08 grid ArcGIS® Grid (1km resolution) The GEBCO_08 grid ArcGIS® Grid (1km resolution) (Fulton, 1995) ArcGIS® Shapefile (scale: 1:5000000) 3D physical model of the Gulf of St Lawrence (Saucier et al., 2003). Data treatment: S. Senneville and Simon St-Onge Drouin, ISMER ArcGIS® Shapefile (5km resolution) As above As above Slope Sediment (7 classes) Sed_Fulton Surface sediment at the sampling site based on the class in Fulton (1995). Bottom current velocity (m.s-1) V_mn_M V_min_M V_max_M V_SD_M V_n90_M Bottom temperature T_mn_M T_min_M For each year, five metrics of the variable are calculated: mean, minimum, maximum, standard deviation and percentile 90 (i.e., value that has 90% of the observations below it). The 20072009 mean is calculated for each metric. As above Institut des Sciences de la Mer (ISMER) Oceanic System Simulation and Analysis Laboratory (LASSO) As above tool from ArcGIS®. As above Annual trawl survey Slope (%) Value calculated with the ʽ3D analystʼ As above Fisheries and Oceans Canada Fisheries and Oceans Canada General Bathymetric Chart of the Oceans (GEBCO) General Bathymetric Chart of the Oceans (GEBCO) Geological Survey of Canada Depth (continuous layer). Data treatment: (Dutil et al., 2011) Raw data: statistics from (Petrie et al., 1996) computed from an oceanographic database with observations beginning in 1910 Data treatment: (Dutil et al., 2011) Raw data: statistics from (Petrie et al., 1996) computed from an oceanographic database with observations beginning in 1910 Data treatment: (Dutil et al., 2011) Raw data: (Loring & Nota, 1973) Recoding: (Dutil et al., 2011) (°C) Bottom salinity T_max_M T_SD_M T_n90_M S_mn_M S_min_M S_max_M S_SD_M S_n90_M As above As above As above As above Figure S1 Ecological maps established from nine-leaf MRTs based on different biological datasets. Distinct habitats are identified by different colors. Areas not classified by the model appear in white. Map (a) Echinodermata is used for comparison across taxonomic groups. Maps (b) and (c) are used for comparison across taxonomic levels and are based on the ʽVertebrataʼ dataset reduced to taxa identified at the species level. Map (b) is based on records at the taxonomic level of genus whereas map (c) is based on records at the taxonomic level of order. Figure S2 Joint maps showing common ecological units for the comparison of three pairs of ecological maps. Distinct common habitats are identified by different colors. Areas not classified or showing classification disagreement appear in white. For comparison across taxonomic groups, ʽVertebrataʼ ecological map is compared to (a) ʽArthropodaʼ ecological map. For comparison across taxonomic levels, the ecological map based on the Vertebrata’ dataset at the species level is compared to the map created from the same dataset aggregated at (b) genus and (c) order levels. References Dutil, J.-D., Proulx, S., Chouinard, P.-M. & Borcard, D. (2011) A Hierarchical Classification of the Seabed Based on Physiographic and Oceanographic Features in the St. Lawrence. Canadian Technical Report of Fisheries and Aquatic Sciences, 2916. Fulton, R.J., compiler, 1995. Surficial materials of Canada. Geological Survey of Canada, map 1880A, scale 1:5000000. Loring, D.H., Nota, D.J.G.,1973. Morphology and sediment of the Gulf of St.Lawrence. Bulletin Fisheries Research Board of Canada, 182. Saucier, F.J., Roy, F., Gilbert, D., Pellerin, P. & Ritchie, H. (2003) Modeling the formation and circulation processes of water masses and sea ice in the Gulf of St. Lawrence, Canada. Journal of Geophysical Research-Oceans, 108, 1-20.
