MAIN THE SOCIO - ECONOMIC ESTIMATED
advertisement
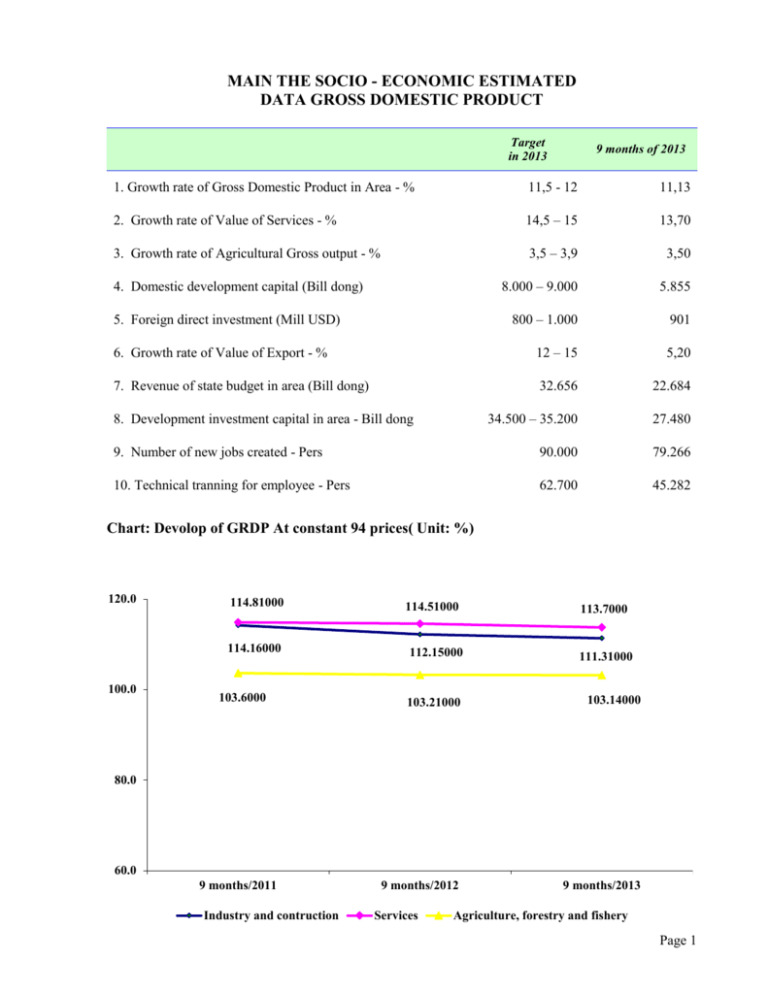
MAIN THE SOCIO - ECONOMIC ESTIMATED DATA GROSS DOMESTIC PRODUCT Target in 2013 9 months of 2013 1. Growth rate of Gross Domestic Product in Area - % 11,5 - 12 11,13 2. Growth rate of Value of Services - % 14,5 – 15 13,70 3. Growth rate of Agricultural Gross output - % 3,5 – 3,9 3,50 8.000 – 9.000 5.855 800 – 1.000 901 6. Growth rate of Value of Export - % 12 – 15 5,20 7. Revenue of state budget in area (Bill dong) 32.656 22.684 34.500 – 35.200 27.480 9. Number of new jobs created - Pers 90.000 79.266 10. Technical tranning for employee - Pers 62.700 45.282 4. Domestic development capital (Bill dong) 5. Foreign direct investment (Mill USD) 8. Development investment capital in area - Bill dong Chart: Devolop of GRDP At constant 94 prices( Unit: %) 120.0 114.81000 114.16000 100.0 103.6000 114.51000 112.15000 113.7000 111.31000 103.21000 103.14000 9 months/2012 9 months/2013 80.0 60.0 9 months/2011 Industry and contruction Services Agriculture, forestry and fishery Page 1 GROSS DOMESTIC PRODUCT (GRDP) 9 months of 2012 At current prices of GRDP (Bill dongs) 9 months of 2013 87.334,67 101.889,17 + Industry and Contruction 49.091,06 57.077,15 + Services 32.177,13 38.237,07 6.066,48 6.574,95 32.145,65 35.722,37 21.079,82 23.463,92 + Services 8.001,73 9.098,03 + Agriculture, forestry and fishery 3.064,10 3.160,42 111,87 111,13 + Industry and Contruction 112,15 111,31 + Services 114,51 113,70 + Agriculture, forestry and fishery 103,21 103,14 + Agriculture, forestry and fishery At constant 1994 prices of GRDP (Bill dongs) + Industry and Contruction Index of Growth compare with 9 months of previous year( At constant 1994 prices ) Unit ;% Gross domestic product (At constant 1994 prices) Unit: Bill dongs 23463.920 25000.0 21079.820 20000.0 15000.0 10000.0 9098.030 8001.730 3160.420 3064.10 5000.0 .0 9 months/2012 Industry and contruction 9 months/2013 Services Agriculture, forestry and fishery Page 2 INDUSTRIAL PRODUCTION INDEX 9 months of 2012 over the same period (%) The index of industrial production (IIP) 9 months of 2013 over the same period (%) 107,04 107,47 58,31 75,90 107,92 108,06 97,43 107,41 103,80 107,90 107,88 97,81 - Manufacture of leather and related products 113,94 122,92 - Manufacture of textiles 103,32 119,98 - Manufacture of wearing apparel 109,92 112,52 - Manufacture of orther non-metallic products 100,16 126,66 - Manufacture of chemical products 107,53 106,99 - Manufacture of furniture 107,71 105,13 * The index of industrial production by industry division: - Mining Industry - Processing industry - Manufacture electricity, Gas, steam anh air conditioning supply - Water supply, sewerage, waste manegement and remediation activites in which the: - Manufacture of food products Chart: Index of industrial productrion. Unit:% 120.0 100.0 108.34000 101.15000 102.66000 100.15000 109.04000 108.06000 107.41000 107.9000 115.13000 103.18000 88.98000 80.0 75.9000 60.0 40.0 september 2013 compared with augst 2013 9 months of 2012 over the same period 9 months of 2013 over the same period Mining Industry Processing industry Manufacture electricity, Gas, steam Water supply, sewerage, waste Page 3 YIELD SOME MAINLY INDUSTRIAL PRODUCTS Unit 9st quarter 2013 9st quarter 2013 over the 9st quarter 2012 (%) Stone building kinds Cu.m 8.277.603,77 74,34 Kinds coffee Ton 68.852,39 63,19 Sodium glutamate Ton 159.683,00 97,86 Food for feeding livestock Ton 2.601.384,96 102,45 Shredded tobacco Ton 16.835,91 112,29 Yarns kinds Ton 289.773,00 102,17 Thous.met 240.591,30 86,29 Thous. Pieces 87.259,53 120,54 Thous.pairs 54.806,97 110,12 Papers Ton 17.588,00 27,82 Botanical protection drugs Ton 18.721,38 126,11 High quality paint Ton 64.257,20 114,82 Shower gel, cleansing milk. . . . . . . . Ton 2.839.495,38 173,43 Washing soap Ton 74.200,25 94,37 PP bags Ton 78.014,05 108,53 Bricks Thous.pieces 157.600,96 75,59 Washer Piece 480.478,39 97,51 Lumber Pcs 4.802.440,00 94,57 Mill.Kwh 9.963,59 108,34 Cu.m 73.507,00 107,90 Clothes Ready made clothes Footwears Electricity Running water Page 4 AGRICULTURE, FORESTRY AND FISHERY 9 months of 2013 A. AGRICULTURE, FORESTRY AND FISHERY GROSS OUTPUT - BILL DONG - Agricultural gross output + Cultivation + Livestock + Services - Forestry gross output - Fishery gross output 9 months of 2013 over the same period (%) 18.806.497 103,50 17.597.742 9.336.292 7.720.802 540.648 176.189 1.032.566 103,38 102,27 104,55 106,25 108,24 104,73 118.754 66.594 52.160 16.285 15.071 20.229 14.068 6.161 13.592 527 1.135 10.275 1.285 151 189 4.283 99,38 97,45 101,95 100,67 101,11 97,84 100,09 91,49 96,76 86,96 113,05 96,19 88,74 139,81 117,39 106,89 B. PLANTED AREA OF ANNUAL CROPS- HA I. Food Paddy Maize II- Cereals for tuber where: tapioca III. Vegetable, bean of all kinds Vegetable of all kinds Bean of all kinds IV. Annual industrial crops Soya beans Peanut Cane Tobacco Sesame Other crops V.Other annual crops Chart: Agricultural groos output (at constant 94 prices) Unit: Bill dongs 9128.760 7384.593 9336.292 7720.802 1,800 1,500 1,200 900 540.648 508.863 600 300 0 9 months of 2012 Cultivaion Livestock 9 months of 2013 Services Page 5 DEVELOPMENT INVESTMENT 9 months of 2013 over the same period (%) 9 months of 2013 DEVELOPMENT INVESTMENT CAPITAL IN AREA BILL DONG 1. State capital in the area - Central Capital Management 27.479.638 112,35 6.606.456 1.018.576 108,84 105,60 - Local Capital Management 5.587.880 109,46 2. Non-state capital - Own capital of the business organization 7.208.631 3.730.676 112,97 115,90 - Investment capital from households 3.477.955 100,00 13.664.551 113,79 - Business 100% foreign 7.265.255 112,92 - Business 100% foreign capital becomes 6.399.296 114,79 5.855 28 55,28 103,70 5.573 65,74 900,86 57 84,75 146,15 386 62,66 53 112,77 514,86 115,18 3.Foreign investment capital Domestic development capital (the date of 6/6) + Number of licenced enterprises - Enterprise + Registered capital - Bill dong Foreign dỉect Invesment - FDI (the date of 6/6) + Number of licenced projects - Project + Registered capital - Mill USD + Number of increasable capital projects + Number of increasable capital - Mill USD Chart: Development investment capital (Unit: Bill dongs) 13664.5510 14000.0 13000.0 12000.0 11000.0 10000.0 9000.0 8000.0 7000.0 6000.0 5000.0 4000.0 3000.0 2000.0 1000.0 .0 12008.4830 7208.6310 6380.7700 5587.8800 5105.0950 1018.5760 964.5400 9 months of 2012 Central Local Non-State sector 9 months of 2013 Foreign Direct Investment Page 6 TRANSPORT, POST AND TELE-COMMUNICATION 9 months of 2013 Volume of freight in area - Thous tons 9 months of 2013 over the same period (%) 30.079 107,03 2.017.996 107,38 56.770 107,71 3.696.013 108,13 489.958 81,20 + Normal phones 9.727 63,39 + Mobile phones 480.231 81,67 24.065 104,21 2.991 113,61 Volume of freight traffic in area-Thous tons/km Volume of passengers in area- Thous passengers Volume of passengers traffic in area- Thous passengers/km Number of develop telephones - Piece Number of existing internet - Piece Receipt of post and telecommunication- Bill dong Chart: Number of develop telephones(Unit: pieces) 761902.0 800000.0 700000.0 588045.0 600000.0 480231.0 500000.0 400000.0 300000.0 200000.0 100000.0 15345.0 10295.0 9727.0 .0 9 months/2011 Normal phones 9 months/2012 9 months/2013 Mobile phones Page 7 RETAIL SALES VALUE OF GOODS AND SERVICES 9 months of 2013 A/ Retail sales value of goods and services - Bill. Dongs By ownerships State Non-State Foreign Direct Investment By kind of activities Trade Hotels, Restaurants Services Tourism B. Structure of retail sales value (%) By ownerships State Non-State Foreign Direct Investment By kind of activities Trade Hotels, Restaurants Services Tourism 9months of 2013 over 9 months of 2012 (%) 74.406,26 113,81 6.892,12 65.191,62 2.322,52 110,62 114,34 108,98 57.999 6.492 9.853 63 112,13 121,70 119,25 120,48 100,00 9,26 87,62 3,12 100,00 77,95 8,73 13,24 0,08 - Chart: Structure of retail sales value 9 months of 2013 by ownerships (%) 3.12000 9.26000 87.62000 State Non-State Foreign Direct Investment Page 8 EXPORT, IMPORT TURN- OVER Unit Exports turn- over Total Central enterprises Local enterprises Foreign invested enterprises Imports turn- over Total Central enterprises Local enterprises Foreign invested enterprises Export Main goods Coffee Honey Cashew nut Woodwork Fine atr pottery Shoes & sandal Garment Import Main goods Fertilizers Industrial chemicals Medicaments Auxilary material for cigarettes Machinery, instrument, accessories Iron and Steel Fabric 9 months of 2013 9 months of 2013 over 9 months of 2012 (%) Thous. USD " " " Thous. USD " " " 8.183.868 38.852 977.866 7.167.150 8.198.321 18.177 781.637 7.398.507 105,2 102,0 102,7 105.6 105,5 101,1 103,3 105,7 Ton Ton Ton Thous. USD " " " 101.729 2.152 21.330 642.363 82.131 1.389.104 1.131.687 51,6 102,1 101,7 102,9 95,9 106,4 105,0 Ton 145.296 74,2 Thous. USD " " " " " 613.077 18.059 87.122 721.330 721.827 508.448 102,4 101,6 103,2 103,8 94,7 106,4 Chart: Export, Import turn – over 8183868.0 Unit: 1000 USD 8200000.0 8198321.0 7794372.0 7779342.0 8000000.0 7770921.0 7800000.0 7600000.0 7400000.0 7200000.0 7054462.0 7000000.0 6800000.0 6600000.0 6400000.0 9 months of 2011 9 months of 2012 9 months of 2013 Exports Imports Page 9 CPI, PRICE INDEX OF GOLD AND USD Đơn vị tính: % price index in with the march 2013 over the Consumer price index 1. Food and foodstuff 2. Beverage and cigarette 3. Garments, footwear , hat 4. Housing and construction materials 5. Houseold equiqment and goods 6. Medicaments , Health 7. Transports 8. Post and communication 9. Education 10. Culture sport, entertainments 11. Other consumer goods and services Price index of gold Price index of USD Base 2009 September 2012 Decembe r /2012 149,25 157,81 132,93 142,97 153,37 139,21 154,25 150,98 87,17 171,73 122,28 156,75 179,46 137,77 103,78 104,02 105,52 106,34 101,27 107,56 102,04 103,50 98,96 101,12 102,64 108,28 81,46 101,31 102,92 103,22 105,42 104,33 100,22 105,94 101,25 103,35 98,91 100,66 102,14 106,79 81,08 101,48 August 2013 100,63 101,04 100,13 100,08 101,16 100,72 100,06 99,73 99,86 100,10 100,04 100,75 102,10 100,42 Average of the same period 105,27 102,31 104,48 107,46 104,06 109,27 131,76 106,43 99,10 101,49 103,97 109,66 90,53 99,84 Chart: Retail price index of consumer goods, services(Unit: %) 120.0 103.78000 100.0 80.0 101.31000 81.46000 102.92000 100.63000 102.1000 101.48000 100.42000 81.08000 60.0 40.0 september 2013 compared with september 2013 compared with september 2013 compared with september 2012 december 2012 August 2013 Consumer price index Gold price index USD price index Page 10 OCIALITY – CULTURE 9 months of 2013 I. HEALTH Number of impaludism inmate – Per 9 months of 2013 over 9 months of 2012 (%) 163 81,5 38.245 122,7 582.439 102,54 23.393 118,53 + Kindergarten 111.137 104,51 + Secondary 447.909 101,36 26.223 103,41 + Kindergarten 3.896 107,59 + Nursery 1.685 108,92 20.642 102,23 Number of new jobs created - Pers 79.266 100,9 Professiona trainees -pers 45.282 95,7 Number of babies was injected all kind of vaccine - Baby II. EDUCATION Number of students - Students + Nursery Number of teachers - Teachers + Secondary III. EMPLOY- EXPEDITE Chart: Number of student(Unit: Pupil) 441917.0 447909.0 450000.0 400000.0 350000.0 300000.0 250000.0 200000.0 106343.0 150000.0 111137.0 100000.0 50000.0 19736.0 23393.0 .0 9 months/2012 Nursery 9 months/2013 Kindergarten Secondary Page 11

