Additional file 1
advertisement
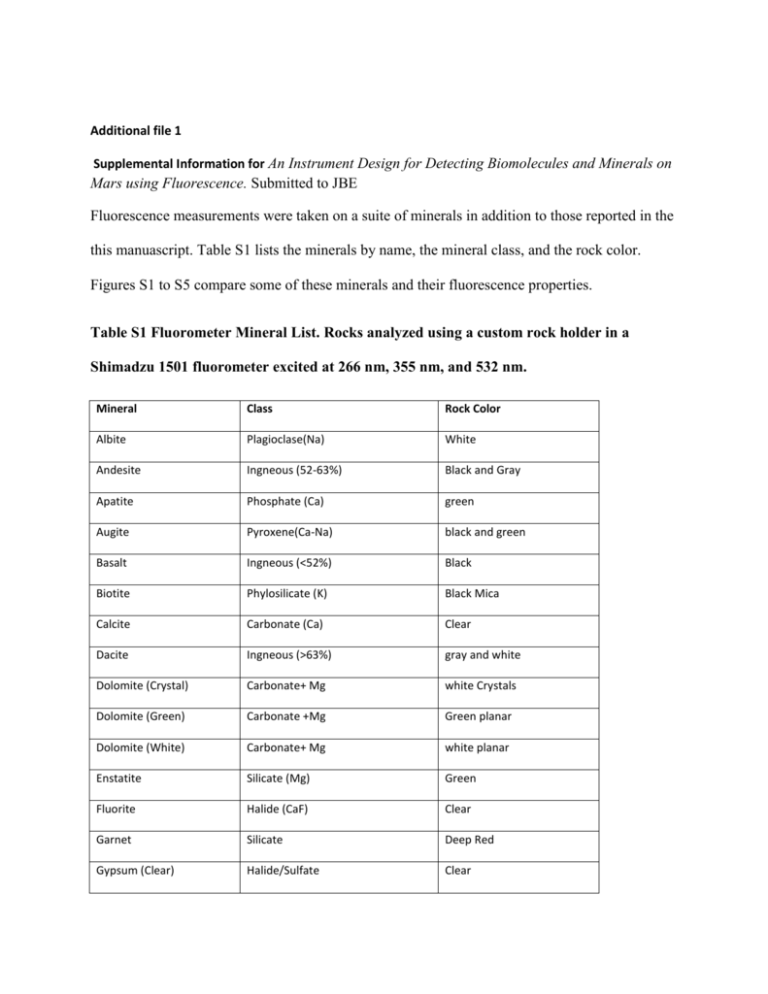
Additional file 1 Supplemental Information for An Instrument Design for Detecting Biomolecules and Minerals on Mars using Fluorescence. Submitted to JBE Fluorescence measurements were taken on a suite of minerals in addition to those reported in the this manuascript. Table S1 lists the minerals by name, the mineral class, and the rock color. Figures S1 to S5 compare some of these minerals and their fluorescence properties. Table S1 Fluorometer Mineral List. Rocks analyzed using a custom rock holder in a Shimadzu 1501 fluorometer excited at 266 nm, 355 nm, and 532 nm. Mineral Class Rock Color Albite Plagioclase(Na) White Andesite Ingneous (52-63%) Black and Gray Apatite Phosphate (Ca) green Augite Pyroxene(Ca-Na) black and green Basalt Ingneous (<52%) Black Biotite Phylosilicate (K) Black Mica Calcite Carbonate (Ca) Clear Dacite Ingneous (>63%) gray and white Dolomite (Crystal) Carbonate+ Mg white Crystals Dolomite (Green) Carbonate +Mg Green planar Dolomite (White) Carbonate+ Mg white planar Enstatite Silicate (Mg) Green Fluorite Halide (CaF) Clear Garnet Silicate Deep Red Gypsum (Clear) Halide/Sulfate Clear Halite Halide (NaCl) Clear Hematite (black) Oxide (FeO3) Black Hematite (red) Oxide (FeO3) Red more Fe Hornblend Amphibole/ silicate Black Imenite Oxide (FeTiO3) Black Jasper Silicate Red Jarosite Sulfate (KFe3(SO4)2(OH)6 Yellow, Brown,Red Limestone Carbonate (Ca) White Magnetite Oxide (FeO4) Black Microcline Feldspar (K) White Muscovite Phylosilicate (K, Al) Clear Mica Olivine Silicate(Fe) Green Perchlorates Oxide (XClO4) White grains Phlogopite Phylosilicate (K Mg) Brown Mica Pyrolusite Oxide (MnO2) Black Branching pattern Quartz(clear) Silicate Clear Quartz (smoky) Silicate(K, Mg,Fe) Gray Rhodochrosite Carbonate (Mn) Pink Serpentine Phylosilicate (Mg) Green, Reddish intrusions Siderite Carbonate (Fe) brown Sulfur Sulfate (S) Bright Yellow Titanite (Spene) Silicate(CaTiO)SiO4) Black Travertine Carbonate (Ca) Milky white to brown 100 80 60 40 20 0 Basalt Andesite 261 297 333 369 405 441 477 513 549 585 621 657 693 729 765 801 837 873 Fluorescent Units Varied Silica Content at 266 Ex Dacite Emission Wavelength Fluorescent Units 100 Varied Silica Content at 355 Ex Basalt Andesite Dacite 80 60 40 20 350 381 412 443 474 505 536 567 598 629 660 691 722 753 784 815 846 877 0 Emission Wavelength Fluorescent Units 50 Varied Silica Content at 532 nm Ex Basalt Andesite Dacite 40 30 20 10 530 549 568 587 606 625 644 663 682 701 720 739 758 777 796 815 834 853 872 891 0 Emission Wavelength Figure S1 Varied Silica Content Emission Spectra. Igneous Rocks classified by silica content. Basalt has the lowest silica content, while Dacite has the highest. The middle silica content (Andesite) has the highest fluorescence. Sulfates at 266 excitation Fluorescent Units 1000 Sulfur 800 Jarosite Gypsum 600 400 200 260 293 326 359 392 425 458 491 524 557 590 623 656 689 722 755 788 821 854 887 0 Emission Wavelength Sulfates at 355 nm Excitation Fluorescent Units 100 80 Sulfur Jarosite Gypsum 60 40 20 350 377 404 431 458 485 512 539 566 593 620 647 674 701 728 755 782 809 836 863 890 0 Emission Wavelength Fluorescent Units 200 Sulfates at 532 nm Excitation 150 Sulfur Jarosite Gypsum 100 50 530 548 566 584 602 620 638 656 674 692 710 728 746 764 782 800 818 836 854 872 890 0 Emission Wavelength Figure S2 Sulfates Emission Spectra. Elemental sulfur compared with sulfate compounds. Ilmenite Pyrolusite Magnetite 500 0 530 545 560 575 590 605 620 635 650 665 680 695 710 725 740 755 770 785 800 815 830 845 860 875 890 Fluorescent Units Oxides at 532 nm Excitation 1000 Emission Wavelength Figure S3 Oxides Emission Spectra. Ilmenite an TiO abundant at impact sites and on the Moon, compared with Pyrolusite a mineral that branches similar to trees, and Magnetite a known Mars mineral. Fluorescent Units 5 CaCO3 Fluorescence at 266 nm Excitation Calcite CaCO3 3 1 Limestone CaCO3 -1 Travertine CaCO3 -3 260 273 286 299 312 325 338 351 364 377 390 403 416 429 442 455 468 481 494 507 520 -5 Emission Wavelength 0 CaCO3 Fluorescence at 355 Excitaton Calcite CaCO3 Limestone CaCO3 Travertine CaCO3 -2 -4 -6 -8 350 363 376 389 402 415 428 441 454 467 480 493 506 519 532 545 558 571 584 597 610 623 636 649 662 675 688 Fluorescent Units 2 Emmission Wavelength 4 CaCO3 Fluorescence at 532 nm Excitation Calcite CaCO3 2 Fluorescent Units Limestone CaCO3 0 Travertine CaCO3 -2 -4 530 544 558 572 586 600 614 628 642 656 670 684 698 712 726 740 754 768 782 796 810 824 838 852 866 880 894 -6 Emission Wavelength Figure S4 Same Composition Emission Spectra. Fluorescence from three minerals with the same composition, but formed under different conditions.

