Graphing Activity: Solving the Digestive Enzyme Mix Up
advertisement
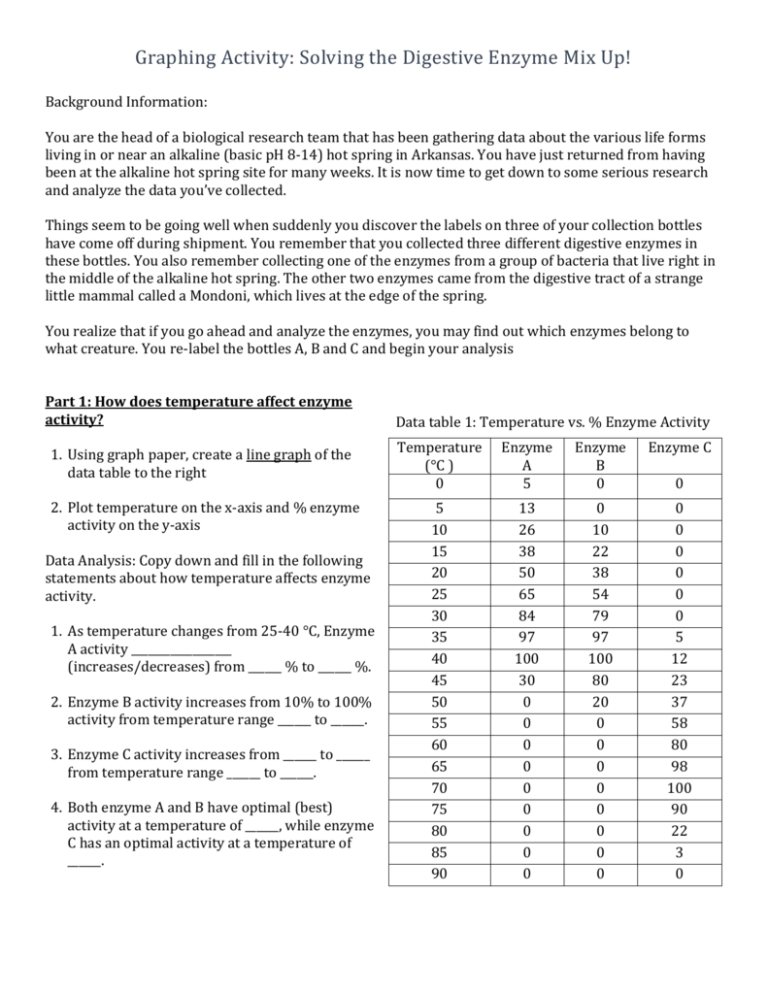
Graphing Activity: Solving the Digestive Enzyme Mix Up! Background Information: You are the head of a biological research team that has been gathering data about the various life forms living in or near an alkaline (basic pH 8-14) hot spring in Arkansas. You have just returned from having been at the alkaline hot spring site for many weeks. It is now time to get down to some serious research and analyze the data you’ve collected. Things seem to be going well when suddenly you discover the labels on three of your collection bottles have come off during shipment. You remember that you collected three different digestive enzymes in these bottles. You also remember collecting one of the enzymes from a group of bacteria that live right in the middle of the alkaline hot spring. The other two enzymes came from the digestive tract of a strange little mammal called a Mondoni, which lives at the edge of the spring. You realize that if you go ahead and analyze the enzymes, you may find out which enzymes belong to what creature. You re-label the bottles A, B and C and begin your analysis Part 1: How does temperature affect enzyme activity? Data table 1: Temperature vs. % Enzyme Activity 1. Using graph paper, create a line graph of the data table to the right Temperature (°C ) 0 Enzyme A 5 Enzyme B 0 Enzyme C 2. Plot temperature on the x-axis and % enzyme activity on the y-axis 5 10 15 20 25 30 35 40 45 50 55 60 65 70 75 80 85 90 13 26 38 50 65 84 97 100 30 0 0 0 0 0 0 0 0 0 0 10 22 38 54 79 97 100 80 20 0 0 0 0 0 0 0 0 0 0 0 0 0 0 5 12 23 37 58 80 98 100 90 22 3 0 Data Analysis: Copy down and fill in the following statements about how temperature affects enzyme activity. 1. As temperature changes from 25-40 °C, Enzyme A activity __________________ (increases/decreases) from ______ % to ______ %. 2. Enzyme B activity increases from 10% to 100% activity from temperature range ______ to ______. 3. Enzyme C activity increases from ______ to ______ from temperature range ______ to ______. 4. Both enzyme A and B have optimal (best) activity at a temperature of ______, while enzyme C has an optimal activity at a temperature of ______. 0 Graphing Activity: Solving the Digestive Enzyme Mix Up! Part 2: How does pH Level affect enzyme activity? % ENZYME ACTIVITY VS. PH LEVEL Enzyme A Enzyme B Enzyme C 120 % ENZYME ACTIVITY 100 80 60 40 20 0 1 2 3 4 5 6 7 8 9 10 11 12 13 14 PH LEVEL Using the graph above, copy down and fill in the following statements about how pH level affects enzyme activity. 1. Enzyme A has optimal activity at a pH level of _______. Enzyme A activity ______________ (increases/decreases) from 100% to 0% from a pH level ______ to ______. 2. Enzyme B has an optimal activity at a pH level of ______. From pH level 4 to 8, Enzyme activity increases from _____ % to _____ %. However, than going from pH level _____ to _____, enzyme activity decreases from 95% to 12%. 3. Enzyme C has an optimal activity of 90% at a pH level of _____. Enzyme C shows no activity from pH level ______ to ______. Once Enzyme C is exposed to a pH level of _____, there is 10% activity. From pH level _____ to _____, enzyme C activity continually increases, until it drops off to 0% activity at a pH level of _____. Conclusion: Write a 4-5 sentence paragraph where you state which enzyme came from the bacteria living in the alkaline hot springs. 1st sentence = topic sentence and you state which Enzyme (A, B, or C) came from the bacteria living in the alkaline hot springs 2nd-5th sentences = use data from Data Table: % Enzyme Activity vs. Temperature and % Enzyme Activity vs. pH level to justify and support your conclusion Highlight and number your periods.


