elps4904-sup-0001-Figures
advertisement
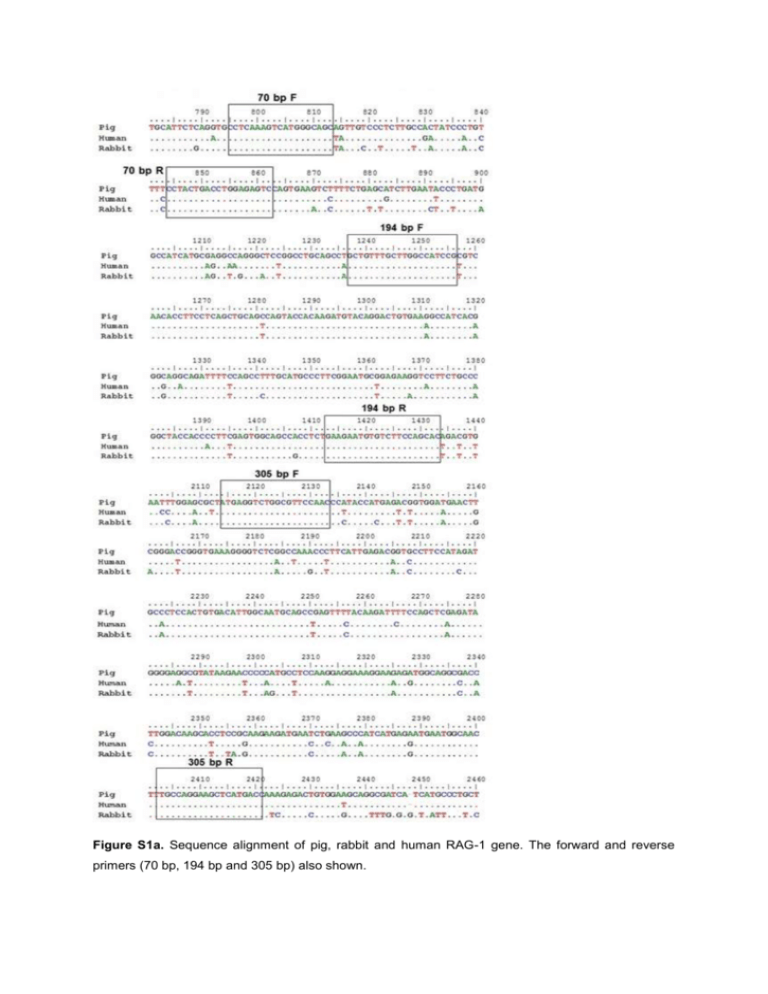
Figure S1a. Sequence alignment of pig, rabbit and human RAG-1 gene. The forward and reverse primers (70 bp, 194 bp and 305 bp) also shown. Figure S1b. Sequence alignment of pig, rabbit and human RAG-1 gene. The forward and reverse primers (384 bp) also show. (a) 70 bp 194 bp 305 bp 384 bp (b) (c) (d) (e) (f) Figure S2. Electropherograms of the 4-plex PCR with human positive control DNA samples (a) 2.80 ng, (b) 0.93 ng, (c) 0.61 ng, (d) 0.31 ng and (e) 0.1 ng. Negative control (f) is also shown. Similar results were obtained with both pig and rabbit DNA. Figure S3. Electropherograms of the 4-plex PCR from the artificially degraded DNA (DNase I digestion) at 0, 10, 15, 30 and 45 min time points. (a) 70 bp 194 bp 305 bp 384 bp (b) (c) (d) (e) Figure S4. Examples of electropherograms generated from 1 µl of DNA extract (from a total of 200 µl) extracted from pig soft muscle tissues collected during February 2010 project at b) 494 ADD, c) 554 ADD, d and e) 603 ADD. Human positive control (a) is also shown (0.5 ng). The amount of DNA in 1 µl of each extract was quantified using real-time PCR: b) 0.68 ng c) 0.85 ng d) 0.73 ng e) 0.62 ng. (a) 70 bp 194 bp 305 bp 384 bp (b) (c) (d) (e) Figure S5. Examples of electropherograms generated from 1 µl of DNA extract (from a total of 200 µl) extracted from pig soft muscle tissues collected during September 2010 project at b) day 18 (254 ADD), c) 30 (342 ADD), d) day 38 (420 ADD) and e) day 44 (490 ADD). Human positive control (a) is also shown (0.6 ng). The amount of DNA in 1 µl of each extract was quantified using real-time PCR: b) 0.41 ng c) 0.37 ng d) 0.41 ng e) 0.13 ng.


