AER electricity weekly report - 30 August – 5 September 2015
advertisement
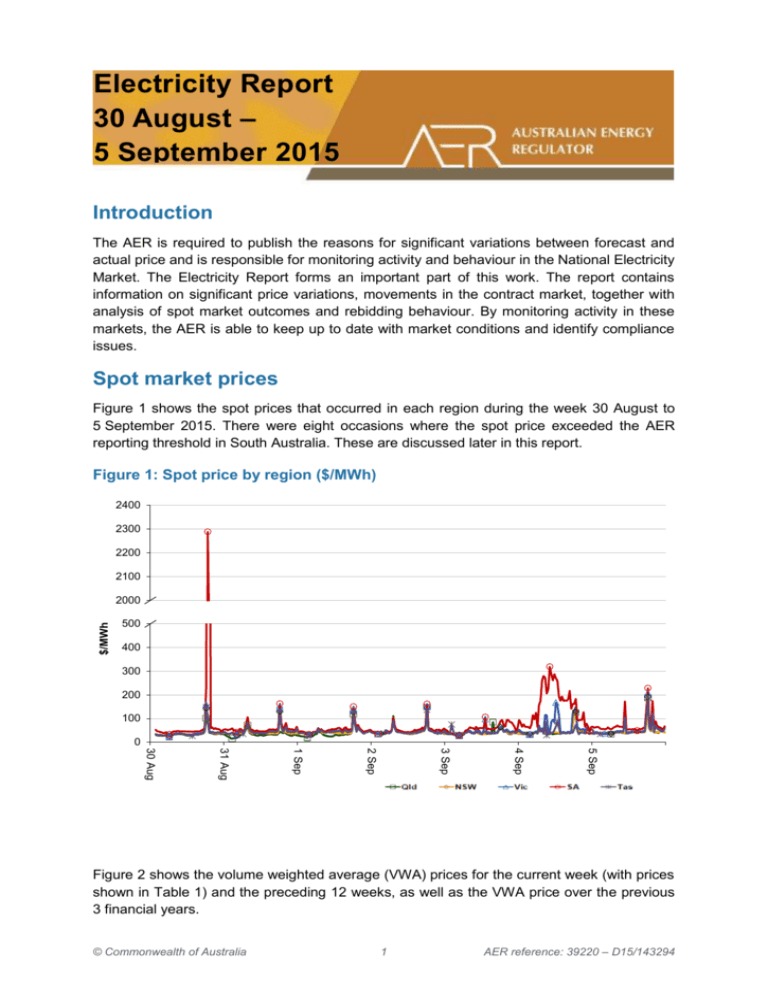
Electricity Report 30 August – 5 September 2015 Introduction The AER is required to publish the reasons for significant variations between forecast and actual price and is responsible for monitoring activity and behaviour in the National Electricity Market. The Electricity Report forms an important part of this work. The report contains information on significant price variations, movements in the contract market, together with analysis of spot market outcomes and rebidding behaviour. By monitoring activity in these markets, the AER is able to keep up to date with market conditions and identify compliance issues. Spot market prices Figure 1 shows the spot prices that occurred in each region during the week 30 August to 5 September 2015. There were eight occasions where the spot price exceeded the AER reporting threshold in South Australia. These are discussed later in this report. Figure 1: Spot price by region ($/MWh) 2400 2300 2200 2100 $/MWh 2000 500 400 300 200 100 0 5 Sep 4 Sep 3 Sep 2 Sep 1 Sep 31 Aug 30 Aug Figure 2 shows the volume weighted average (VWA) prices for the current week (with prices shown in Table 1) and the preceding 12 weeks, as well as the VWA price over the previous 3 financial years. © Commonwealth of Australia 1 AER reference: 39220 – D15/143294 Figure 2: Volume weighted average spot price by region ($/MWh) 120 100 $/MWh 80 60 40 20 0 Current week Previous week Tas 16 Aug 9 Aug SA 2 Aug Vic 26 Jul 19 Jul NSW 12 Jul 5 Jul 28 Jun 21 Jun 14 Jun 7 Jun 14/15 FY 13/14 FY 12/13 FY Qld Table 1: Volume weighted average spot prices by region ($/MWh) Region Qld NSW Vic SA Tas Current week 41 44 52 87 45 14-15 financial YTD 31 40 39 51 36 15-16 financial YTD 45 39 37 73 35 Longer-term statistics tracking average spot market prices are available on the AER website. Spot market price forecast variations The AER is required under the National Electricity Rules to determine whether there is a significant variation between the forecast spot price published by the Australian Energy Market Operator (AEMO) and the actual spot price and, if there is a variation, state why the AER considers the significant price variation occurred. It is not unusual for there to be significant variations as demand forecasts vary and participants react to changing market conditions. A key focus is whether the actual price differs significantly from the forecast price either four or 12 hours ahead. These timeframes have been chosen as indicative of the time frames within which different technology types may be able to commit (intermediate plant within four hours and slow start plant within 12 hours). There were 96 trading intervals throughout the week where actual prices varied significantly from forecasts. This compares to the weekly average in 2014 of 71 counts and the average in 2013 of 97. Reasons for the variations for this week are summarised in Table 2. Based on AER analysis, the table summarises (as a percentage) the number of times when the actual price differs significantly from the forecast price four or 12 hours ahead and the major reason for that variation. The reasons are classified as availability (which means that there is a change in the total quantity or price offered for generation), demand forecast inaccuracy, changes to network capability or as a combination of factors (when there is not one dominant reason). An instance where both four and 12 hour ahead forecasts differ significantly from the actual price will be counted as two variations. 2 Table 2: Reasons for variations between forecast and actual prices Availability Demand Network Combination % of total above forecast 10 36 0 1 % of total below forecast 35 16 0 1 Note: Due to rounding, the total may not be 100 per cent. Generation and bidding patterns The AER reviews generator bidding as part of its market monitoring to better understand the drivers behind price variations. Figure 3 to Figure 7 show, the total generation dispatched and the amounts of capacity offered within certain price bands for each 30 minute trading interval in each region. Figure 3: Queensland generation and bidding patterns 12000 10000 MW 8000 6000 4000 2000 0 12 noon - 5 Sep 3 12 noon - 4 Sep $0/MWh to $50/MWh $500/MWh to $5000/MWh 12 noon - 3 Sep 12 noon - 2 Sep 12 noon - 1 Sep 12 noon - 31 Aug 12 noon - 30 Aug <$0/MWh $100/MWh to $500/MWh Total generation (MW) $50/MWh to $100/MWh Above $5000/MWh Figure 4: New South Wales generation and bidding patterns 14000 12000 10000 MW 8000 6000 4000 2000 0 12 noon - 5 Sep 12 noon - 4 Sep 12 noon - 3 Sep 12 noon - 2 Sep 12 noon - 1 Sep 12 noon - 31 Aug 12 noon - 30 Aug <$0/MWh $100/MWh to $500/MWh Total generation (MW) $50/MWh to $100/MWh Above $5000/MWh $0/MWh to $50/MWh $500/MWh to $5000/MWh Figure 5: Victoria generation and bidding patterns 10000 9000 8000 7000 MW 6000 5000 4000 3000 2000 1000 0 $50/MWh to $100/MWh Above $5000/MWh 12 noon - 5 Sep 4 12 noon - 4 Sep $0/MWh to $50/MWh $500/MWh to $5000/MWh 12 noon - 3 Sep 12 noon - 2 Sep 12 noon - 1 Sep 12 noon - 31 Aug 12 noon - 30 Aug <$0/MWh $100/MWh to $500/MWh Total generation (MW) Figure 6: South Australia generation and bidding patterns 3000 2500 MW 2000 1500 1000 500 0 12 noon - 5 Sep $0/MWh to $50/MWh $500/MWh to $5000/MWh 12 noon - 4 Sep 12 noon - 3 Sep 12 noon - 2 Sep 12 noon - 1 Sep 12 noon - 31 Aug 12 noon - 30 Aug <$0/MWh $100/MWh to $500/MWh Total generation (MW) $50/MWh to $100/MWh Above $5000/MWh Figure 7: Tasmania generation and bidding patterns 2500 2000 MW 1500 1000 500 0 12 noon - 5 Sep 5 12 noon - 4 Sep $0/MWh to $50/MWh $500/MWh to $5000/MWh 12 noon - 3 Sep 12 noon - 2 Sep 12 noon - 1 Sep 12 noon - 31 Aug 12 noon - 30 Aug <$0/MWh $100/MWh to $500/MWh Total generation (MW) $50/MWh to $100/MWh Above $5000/MWh Frequency control ancillary services markets Frequency control ancillary services (FCAS) are required to maintain the frequency of the power system within the frequency operating standards. Raise and lower regulation services are used to address small fluctuations in frequency, while raise and lower contingency services are used to address larger frequency deviations. There are six contingency services: fast services, which arrest a frequency deviation within the first 6 seconds of a contingent event (raise and lower 6 second) slow services, which stabilise frequency deviations within 60 seconds of the event (raise and lower 60 second) delayed services, which return the frequency to the normal operating band within 5 minutes (raise and lower 5 minute) at which time the five minute dispatch process will take effect. The Electricity Rules stipulate that generators pay for raise contingency services and customers pay for lower contingency services. Regulation services are paid for on a “causer pays” basis determined every four weeks by AEMO. The total cost of FCAS on the mainland for the week was $315 000 or less than 1 per cent of energy turnover on the mainland. The total cost of FCAS in Tasmania for the week was $35 000 or around 3.5 per cent of energy turnover in Tasmania. Figure 8 shows the daily breakdown of cost for each FCAS for the NEM, as well as the average cost since the beginning of the previous financial year. Figure 8: Daily frequency control ancillary service cost 100 000 80 000 60 000 $ 40 000 20 000 0 Raise Reg Lower Reg 5 Sep Raise 5min Lower 5min 4 Sep 6 3 Sep Raise 60sec Lower 60sec 2 Sep 1 Sep 31 Aug 30 Aug Average cost Raise 6sec Lower 6sec Detailed market analysis of significant price events We provide more detailed analysis of events where the spot price was greater than three times the weekly average price in a region and above $250/MWh or was below -$100/MWh. South Australia There were eight occasions where the spot price in South Australia was greater than three times the South Australia weekly average price of $87/MWh and above $250/MWh. Sunday, 30 August Table 3: Price, Demand and Availability Time Price ($/MWh) Demand (MW) Availability (MW) Actual 4 hr forecast 12 hr forecast Actual 4 hr forecast 12 hr forecast Actual 4 hr forecast 12 hr forecast 7 pm 2288.47 85.20 88.46 1745 1763 1786 1899 2116 2139 7.30 pm 1846.35 72.29 85.51 1818 1812 1831 1910 2118 2152 Conditions at the time saw demand close to forecast, while available capacity was up to 217 MW below that forecast four hours ahead. In the lead up to the first price spike, AGL’s Torrens Island unit B4 tripped, removing 200 MW of available capacity priced at $65/MWh or lower in the region. From 7.16 pm, an actual lack of reserve level 1 (LOR1) market notice was published by AEMO for the period from 7 pm to 7.30 pm, with a subsequent LOR1 notice published from the 7.40 pm dispatch interval until 8.10 pm. At 6.40 pm, demand increased by 97 MW, largely as a result of a significant decrease in non-scheduled generation output.1 With other lower priced available generation being dispatched at maximum availability, ramp rate limited (Northern unit 1), or requiring additional time to synchronise (Dry Creek unit 3) the dispatch price spiked to $13 331/MWh for that interval. The price returned to $75/MWh for the next dispatch interval following rebidding to lower prices2 and a decrease in demand of 120 MW (mostly due to an increase in output from the non-scheduled generating units). At 6.40 pm, Alinta Energy rebid 43 MW of available capacity at its Northern Power Station unit 1 from below $95/MWh to $13 330/MWh, resulting in its generation output being reduced.3 While lower priced generation was either dispatched at its maximum availability or ramp rate limited (Dry Creek unit 2), Dry Creek unit 3 set the dispatch price at $13 331/MWh. The price returned to $46/MWh for the next dispatch interval following rebidding to lower prices4 and a decrease in demand of 116 MW (mostly due to an increase in non-scheduled generation). Friday, 4 September 1 Non-scheduled units at Angaston, Port Stanvac and Lonsdale significantly decreased output for the dispatch interval. The resulting change in flows toward South Australia on the Heywood interconnector saw the constraint managing the thermal loading on the 275/500 kV transformer violated when flows exceeded the transformer rating threshold. 2 540 MW of generation was rebid to the price floor effective from 7.45 pm. 3 Northern Power Station unit 2 was taken offline from 27 August and has remained unavailable. 4 270 MW of generation was rebid to the price floor effective from 7.25 pm. 7 Table 4: Price, Demand and Availability Time Price ($/MWh) Demand (MW) Availability (MW) Actual 4 hr forecast 12 hr forecast Actual 4 hr forecast 12 hr forecast Actual 4 hr forecast 12 hr forecast 8.30 am 280.12 287.99 288.09 1634 1701 1731 1927 2107 2126 9 am 273.04 287.99 287.99 1637 1680 1714 1917 2101 2122 10.30 am 319.54 174.99 174.99 1545 1534 1554 1865 2083 2099 11 am 288.17 174.99 174.99 1516 1481 1501 1865 2075 2093 Midday 288.49 174.99 174.99 1487 1442 1439 1923 2075 2090 12.30 am 271.38 174.99 174.99 1461 1450 1419 1921 2085 2098 Conditions at the time saw demand close to forecast, while available capacity ranged from 152 MW to 218 MW below that forecast four hours ahead for the affected trading intervals. While prices were close to those forecast for the 8.30 am and 9 am trading intervals, the remaining intervals were forecast to increase above $250/MWh in the hours leading up to dispatch. The lower than forecast capacity was largely a result of AGL gradually reducing the availability at its Torrens Island unit B3, reporting “unexpected/plant limits~106 AUX/plant failure” in its rebidding reasons. However, rebidding leading up to dispatch saw AGL and other participants shifting available generation into lower price bands. Dispatch prices generally increased from $175/MWh, to the next highest offered bands around $290/MWh and $350/MWh throughout the period following small variations in demand. Interconnectors were supplying generation to South Australia at their limit, with flows affected by constraints managing the planned outage of the two Keith to Tailem Bend 132 kV lines.5 5 The constraints managing the planned outage of the Keith to Tailem Bend parallel lines from 2 – 11 September prevent a post contingent overload on one of the South East to Tailem Bend 275 kV lines in the event of a trip on the parallel line. 8 Financial markets Figure 9 shows for all mainland regions the prices for base contracts (and total traded quantities for the week) for each quarter for the next four financial years. 120 900 100 750 80 600 60 450 40 300 20 150 0 Number of contracts traded $/MWh Figure 9: Quarterly base future prices Q3 2015 – Q2 2019 0 Q2 2019 Q1 2019 Vic volume Vic Q4 2018 Q3 2018 Q2 2018 Q1 2018 NSW volume NSW Q4 2017 Q3 2017 Q2 2017 Q1 2017 Q4 2016 Q3 2016 Q2 2016 Q1 2016 Q4 2015 Q3 2015 Qld volume Qld SA volume SA Source. ASXEnergy.com.au Figure 10 shows how the price for each regional Quarter 1 2016 base contract has changed over the last 10 weeks (as well as the total number of trades each week). The closing quarter 1 2014 and quarter 1 2015 prices are also shown. The AER notes that data for South Australia is less reliable due to very low numbers of trades. Figure 10: Price of Q1 2016 base contracts over the past 10 weeks (and the past 2 years) 100 600 500 80 70 400 $/MWh 60 50 300 40 200 30 20 100 10 0 0 Current 23 Aug Vic volume Vic 16 Aug 09 Aug NSW volume NSW 02 Aug 26 Jul 19 Jul 12 Jul 05 Jul 28 Jun Q1 2015 Q1 2014 Qld volume Qld SA volume SA Note. Base contract prices are shown for each of the current week and the previous 9 weeks, with average prices shown for yearly periods 1 and 2 years prior to the current year. Source. ASXEnergy.com.au 9 Number of contracts traded 90 Prices of other financial products (including longer-term price trends) are available in the Performance of the Energy Sector section of our website. Figure 11 shows how the price for each regional Quarter 1 2016 cap contract has changed over the last 10 weeks (as well as the total number of trades each week). The closing quarter 1 2014 and quarter 1 2015 prices are also shown. Figure 11: Price of Q1 2016 cap contracts over the past 10 weeks (and the past 2 years) 50 250 40 200 35 $/MWh 30 150 25 20 100 15 10 50 5 0 0 SA volume SA Current 10 23 Aug Australian Energy Regulator September 2015 Vic volume Vic 16 Aug Source. ASXEnergy.com.au 09 Aug NSW volume NSW 02 Aug 26 Jul 19 Jul 12 Jul 05 Jul 28 Jun Q1 2015 Q1 2014 Qld volume Qld Number of contracts traded 45
