Lab 3_Quantitative Analysis of Vitamin C
advertisement
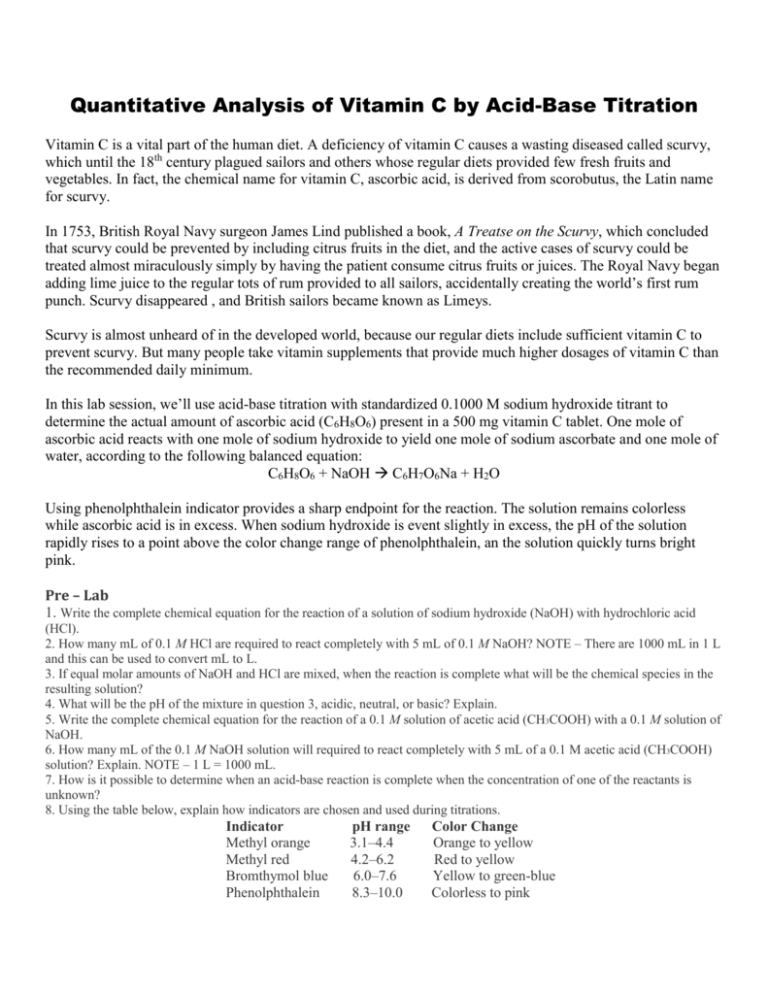
Quantitative Analysis of Vitamin C by Acid-Base Titration Vitamin C is a vital part of the human diet. A deficiency of vitamin C causes a wasting diseased called scurvy, which until the 18th century plagued sailors and others whose regular diets provided few fresh fruits and vegetables. In fact, the chemical name for vitamin C, ascorbic acid, is derived from scorobutus, the Latin name for scurvy. In 1753, British Royal Navy surgeon James Lind published a book, A Treatse on the Scurvy, which concluded that scurvy could be prevented by including citrus fruits in the diet, and the active cases of scurvy could be treated almost miraculously simply by having the patient consume citrus fruits or juices. The Royal Navy began adding lime juice to the regular tots of rum provided to all sailors, accidentally creating the world’s first rum punch. Scurvy disappeared , and British sailors became known as Limeys. Scurvy is almost unheard of in the developed world, because our regular diets include sufficient vitamin C to prevent scurvy. But many people take vitamin supplements that provide much higher dosages of vitamin C than the recommended daily minimum. In this lab session, we’ll use acid-base titration with standardized 0.1000 M sodium hydroxide titrant to determine the actual amount of ascorbic acid (C6H8O6) present in a 500 mg vitamin C tablet. One mole of ascorbic acid reacts with one mole of sodium hydroxide to yield one mole of sodium ascorbate and one mole of water, according to the following balanced equation: C6H8O6 + NaOH C6H7O6Na + H2O Using phenolphthalein indicator provides a sharp endpoint for the reaction. The solution remains colorless while ascorbic acid is in excess. When sodium hydroxide is event slightly in excess, the pH of the solution rapidly rises to a point above the color change range of phenolphthalein, an the solution quickly turns bright pink. Pre – Lab 1. Write the complete chemical equation for the reaction of a solution of sodium hydroxide (NaOH) with hydrochloric acid (HCl). 2. How many mL of 0.1 M HCl are required to react completely with 5 mL of 0.1 M NaOH? NOTE – There are 1000 mL in 1 L and this can be used to convert mL to L. 3. If equal molar amounts of NaOH and HCl are mixed, when the reaction is complete what will be the chemical species in the resulting solution? 4. What will be the pH of the mixture in question 3, acidic, neutral, or basic? Explain. 5. Write the complete chemical equation for the reaction of a 0.1 M solution of acetic acid (CH3COOH) with a 0.1 M solution of NaOH. 6. How many mL of the 0.1 M NaOH solution will required to react completely with 5 mL of a 0.1 M acetic acid (CH3COOH) solution? Explain. NOTE – 1 L = 1000 mL. 7. How is it possible to determine when an acid-base reaction is complete when the concentration of one of the reactants is unknown? 8. Using the table below, explain how indicators are chosen and used during titrations. Indicator Methyl orange Methyl red Bromthymol blue Phenolphthalein pH range 3.1–4.4 4.2–6.2 6.0–7.6 8.3–10.0 Color Change Orange to yellow Red to yellow Yellow to green-blue Colorless to pink Thymol blue 9. Watch the following narrated animation: 1.2–2.8 Red to yellow http://auth.mhhe.com/physsci/chemistry/animations/chang_7e_esp/crm3s5_5.swf Take notes on the following: How are titrations are performed? Why there is only a minor change in pH until the equivalence point? Draw a titration curve for the reaction that was performed in the video. Draw a picture of the molecules in solution at (1) the beginning before any base is added, (2) after 10 mL of base has been added, (3) at the equivalence point, and (4) at the end of the titration. 10. Explore the following simulated titration animation showing the determination of the molarity of an acid using a strong base: http://group.chem.iastate.edu/Greenbowe/sections/projectfolder/flashfiles/stoichiometry/acid_base.html Be sure to note the following as you walk through the simulated titration: Where is the solution of known concentration placed? Where is the solution of unknown concentration placed? When is the molarity of the unknown solution canceled? Why do you believe you need to go drop by drop as you approach the equivalence point. 11. Finally go to the following link and click on “Animation 8 – Titration of Weak Acid, HA, with Strong Base”: http://www.chembio.uoguelph.ca/educmat/chm19104/chemtoons/chemtoons.htm Be sure to note the following as you walk through the simulated titration: What is the difference between a strong acid/strong base titration and a strong base/weak acid titration? What extra component is left in solution? How does the titration curve differ from the one that you drew previously? 12. You may want to also check out the following resources in order to help develop your final procedure: A virtual acid-base titration experiment in which the student may select the acid, base, and indicator, and perform the experiment, including calculations: ■■ http://lrs.ed.uiuc.edu/students/mihyewon/chemlab_introduction.html ■■ A particulate view of a neutralization reaction between HCl and NaOH: http://group.chem.iastate.edu/Greenbowe/sections/projectfolder/animations/HClandNaOHtgV8.html Materials Available Materials Balance Hot Plate Erlenmeyer Flask, 250 mL Graduated Cylinder, 100 mL Buret, 50 mL Ring Stand, rings and clamps Vitamin C Tablet Sodium Hydroxide, 0.1000 M Phenolphtalein Indicator Quantity 1 1 1 1 1 1 500 mg 50 mL 2 – 3 drops Procedure: 1. You will be designing and running a lab based on the information that you have researched. Based on the introduction and pre-lab material, formulate a research question that you relates to the amount of acid contained within a 500 mg Vitamin C tablet. Our Research Question: ________________________________________ ___________________________________________________________. 2. Based on the group that you selected and the information that you have researched, formulate a hypothesis on the amount of ascorbic acid Our Hypothesis: _____________________________________________ ___________________________________________________________. 3. Using the research from the pre – lab, outline a procedure below. Be sure to clearly identify which pieces of equipment (listed in the Materials section) you plan to use during your investigation. 4. Make a simple sketch showing how you plan to set up your equipment, labeling the following: analyte, titrant, buret, Erlenmeyer flask, volumetric pipette. Show where the indicator solution will be added, and comment on your choice of indicator: Why did you choose this one and not another? 5. Create data tables for what you will record data on and where you will put this data. Put this is the data collection section of this handout. 6. Consult with your instructor for approval before beginning your experiment. 7. As you conduct your experiment, keep detailed written records. Be sure to list all steps taken as you perform your experiment, and all measurements and observations made during the experiment. Data Collection Data Tables: Calculations 1. Using the molarity of NaOH that was on the bottle you obtained, calculate the moles of NaOH that you added. Record answer in your Data Table. 2. Since the moles of base = moles of acid when the pink color lasts for 30 seconds, the answer to step 1 is also the moles of ascorbic acid. Using this knowledge, calculate the mass (grams) of ascorbic acid knowing that the molar mass of the ascorbic acid is 176.14 g/mol. Record final mass in your Data Table. Discussion 1. Does your data indicate that the initial hypothesis should be accepted or rejected? Cite specific data to support your acceptance or rejection! 2. What were the inherent structural errors that were introduced as a result of your experimental design? How did these impact your final data? How can the lab be fixed in order to improve your results should you repeat the lab? 3. What next steps could you take in order to further investigate this topic? Cite specific areas that you believe you could study and how your data allows you to better study these areas. 4. It is likely that the calculated value of Vitamin C contained within the pill and the advertised about did not match up. Do you think it is safe for companies to advertise the wrong about of vitamins contained within each pill? Research into federal laws that regulate the labeling of vitamin supplements and propose a way in which to better monitor that the amount advertised aligns with the amount that is actually in a supplement that is taken.


