Solubility Graphing Practice
advertisement
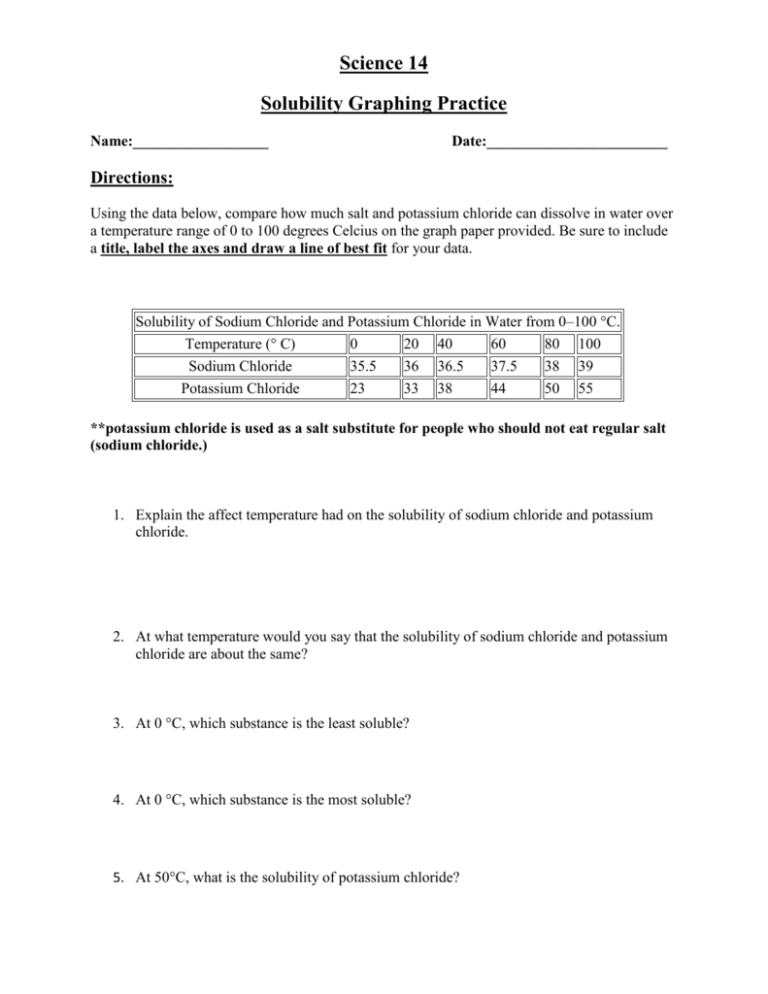
Science 14 Solubility Graphing Practice Name:__________________ Date:________________________ Directions: Using the data below, compare how much salt and potassium chloride can dissolve in water over a temperature range of 0 to 100 degrees Celcius on the graph paper provided. Be sure to include a title, label the axes and draw a line of best fit for your data. Solubility of Sodium Chloride and Potassium Chloride in Water from 0–100 °C. Temperature (° C) 0 20 40 60 80 100 Sodium Chloride 35.5 36 36.5 37.5 38 39 Potassium Chloride 23 33 38 44 50 55 **potassium chloride is used as a salt substitute for people who should not eat regular salt (sodium chloride.) 1. Explain the affect temperature had on the solubility of sodium chloride and potassium chloride. 2. At what temperature would you say that the solubility of sodium chloride and potassium chloride are about the same? 3. At 0 °C, which substance is the least soluble? 4. At 0 °C, which substance is the most soluble? 5. At 50°C, what is the solubility of potassium chloride?
