Tests of Significance for Means CHILDRENS TV KEY
advertisement
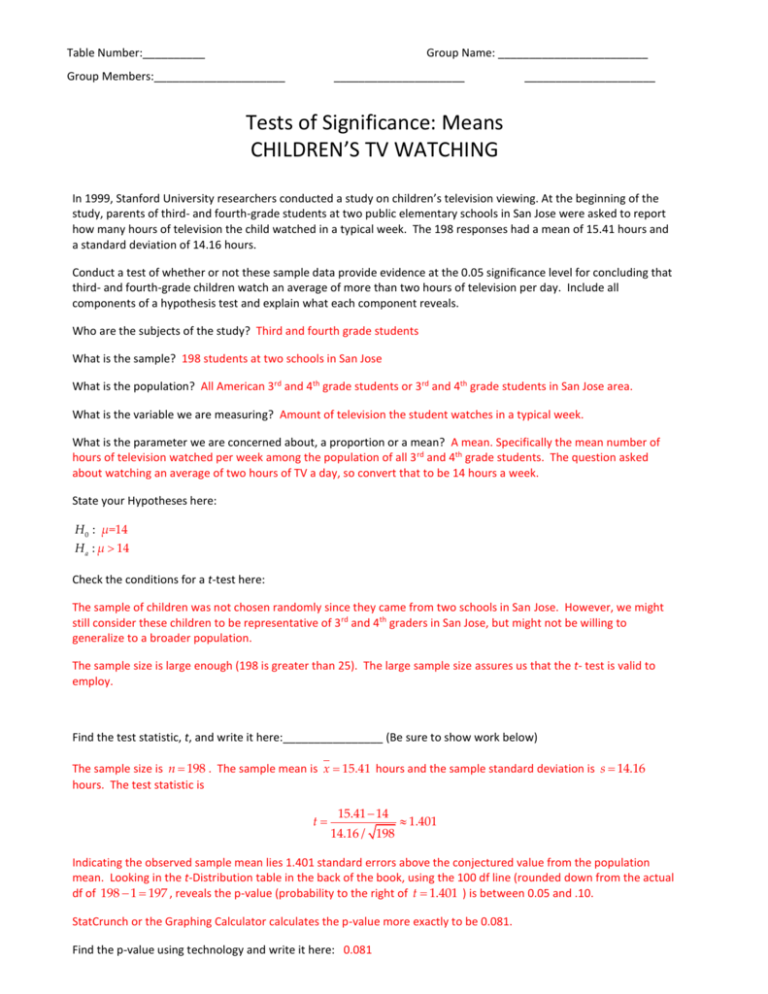
Table Number:__________ Group Name: ________________________ Group Members:_____________________ _____________________ _____________________ Tests of Significance: Means CHILDREN’S TV WATCHING In 1999, Stanford University researchers conducted a study on children’s television viewing. At the beginning of the study, parents of third- and fourth-grade students at two public elementary schools in San Jose were asked to report how many hours of television the child watched in a typical week. The 198 responses had a mean of 15.41 hours and a standard deviation of 14.16 hours. Conduct a test of whether or not these sample data provide evidence at the 0.05 significance level for concluding that third- and fourth-grade children watch an average of more than two hours of television per day. Include all components of a hypothesis test and explain what each component reveals. Who are the subjects of the study? Third and fourth grade students What is the sample? 198 students at two schools in San Jose What is the population? All American 3rd and 4th grade students or 3rd and 4th grade students in San Jose area. What is the variable we are measuring? Amount of television the student watches in a typical week. What is the parameter we are concerned about, a proportion or a mean? A mean. Specifically the mean number of hours of television watched per week among the population of all 3 rd and 4th grade students. The question asked about watching an average of two hours of TV a day, so convert that to be 14 hours a week. State your Hypotheses here: H 0 : μ=14 H a : μ 14 Check the conditions for a t-test here: The sample of children was not chosen randomly since they came from two schools in San Jose. However, we might still consider these children to be representative of 3rd and 4th graders in San Jose, but might not be willing to generalize to a broader population. The sample size is large enough (198 is greater than 25). The large sample size assures us that the t- test is valid to employ. Find the test statistic, t, and write it here:________________ (Be sure to show work below) The sample size is n 198 . The sample mean is x 15.41 hours and the sample standard deviation is s 14.16 hours. The test statistic is t 15.41 14 14.16 / 198 1.401 Indicating the observed sample mean lies 1.401 standard errors above the conjectured value from the population mean. Looking in the t-Distribution table in the back of the book, using the 100 df line (rounded down from the actual df of 198 1 197 , reveals the p-value (probability to the right of t 1.401 ) is between 0.05 and .10. StatCrunch or the Graphing Calculator calculates the p-value more exactly to be 0.081. Find the p-value using technology and write it here: 0.081 Reject or not reject H0 ? Explain. Because the p-value is not less than 0.05 significance level, there is NOT sufficient evidence to reject the null hypothesis. Interpret your conclusion: Thus, there is not sufficient evidence to conclude that the population mean is greater than 14 hours of television watching a week. This conclusion stems from realizing that obtaining a sample mean of 15.41 hours would not be terribly uncommon when the population mean is really 14 hours per week. If you had used a .10 significance level, would your conclusion be different? Explain. If we would have used a 0.10 significance level, we would have concluded that the population mean exceeds 14 hours per week. Adapted from Activity 20-4: Children’s Television Viewing in Rossman, Chance. Workshop Statistics, Discovery with Data. John Wiley Publishers, 2012. Pp. 428-429.

