Research Brief: 2011 vs 2012 cohort
advertisement
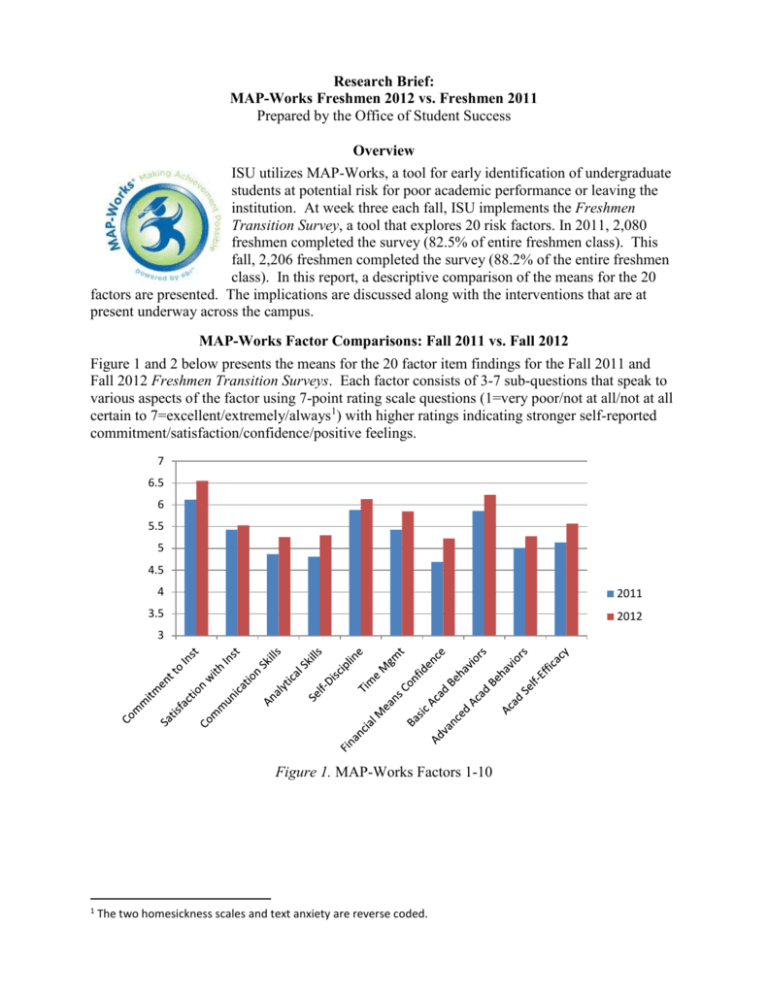
Research Brief: MAP-Works Freshmen 2012 vs. Freshmen 2011 Prepared by the Office of Student Success Overview ISU utilizes MAP-Works, a tool for early identification of undergraduate students at potential risk for poor academic performance or leaving the institution. At week three each fall, ISU implements the Freshmen Transition Survey, a tool that explores 20 risk factors. In 2011, 2,080 freshmen completed the survey (82.5% of entire freshmen class). This fall, 2,206 freshmen completed the survey (88.2% of the entire freshmen class). In this report, a descriptive comparison of the means for the 20 factors are presented. The implications are discussed along with the interventions that are at present underway across the campus. MAP-Works Factor Comparisons: Fall 2011 vs. Fall 2012 Figure 1 and 2 below presents the means for the 20 factor item findings for the Fall 2011 and Fall 2012 Freshmen Transition Surveys. Each factor consists of 3-7 sub-questions that speak to various aspects of the factor using 7-point rating scale questions (1=very poor/not at all/not at all certain to 7=excellent/extremely/always1) with higher ratings indicating stronger self-reported commitment/satisfaction/confidence/positive feelings. 7 6.5 6 5.5 5 4.5 4 2011 3.5 2012 3 Figure 1. MAP-Works Factors 1-10 1 The two homesickness scales and text anxiety are reverse coded. 7 6.5 6 5.5 5 4.5 4 2011 3.5 2012 3 Figure 2. MAP-Works Factors 11-20 Ratings by the Fall 2012 cohort were higher than for the Fall 2011 cohort in 18 of the 20 areas, with the top three increases being homesickness-separation (up .85), test anxiety (up .61, meaning that they have less test anxiety than last year’s cohort), and financial means confidence (up .54). Peer connections was the one factor that declined (down .16) while on-campus livingsocial was essentially unchanged. Although inferential analysis comparing the 2011 and 2012 cohorts has not been completed, the findings do suggest that 2012 entering freshmen appear, in general, to be starting better prepared and have greater confidence in their skills and abilities. Inferential analysis on the 2012 cohort has been done, however, in which the 20 factors were regressed against institutional satisfaction. Three factors, peer connections, commitment to the institution, and academic self-efficacy were shown to be significant, the first two also being predictors for the 2011 cohort. Implications and Interventions The 2012 cohort findings suggest that while there is much to be optimistic about with this cohort, there remain key attention needs, most especially with peer connections. Three questions make up this factor, (1) connections with people who share common interests, (2) connections with people that include them in their activities, and (3) connections with people they like. Another need focuses on the findings for intent to return in the spring term (a sub-item of the commitment to the institution factor). The data revealed that 213 students selected 3, 4, or 5 for this item, the middle of the scale. Another 50 selected 1 or 2, indicating a strong intent not to return for the spring semester. These combined students represent a potential 10 percentage point impact on retention. In light of these findings, curricular and co-curricular attention is needed to enhance opportunities for peer connection. Outreach to students in at least the 3 to 5 rating scale range on intent to return for the spring semester is also needed and is planned. Extensive outreach and programming intervention within residence life based on many of the 2012 MAP-Works findings is also underway. A number of advisors, faculty, and staff have also reached out to students in high risk categories; more is needed, including of students who indicate high financial concerns.


