Friction and mechanism of slip Friction is the force which resists the
advertisement

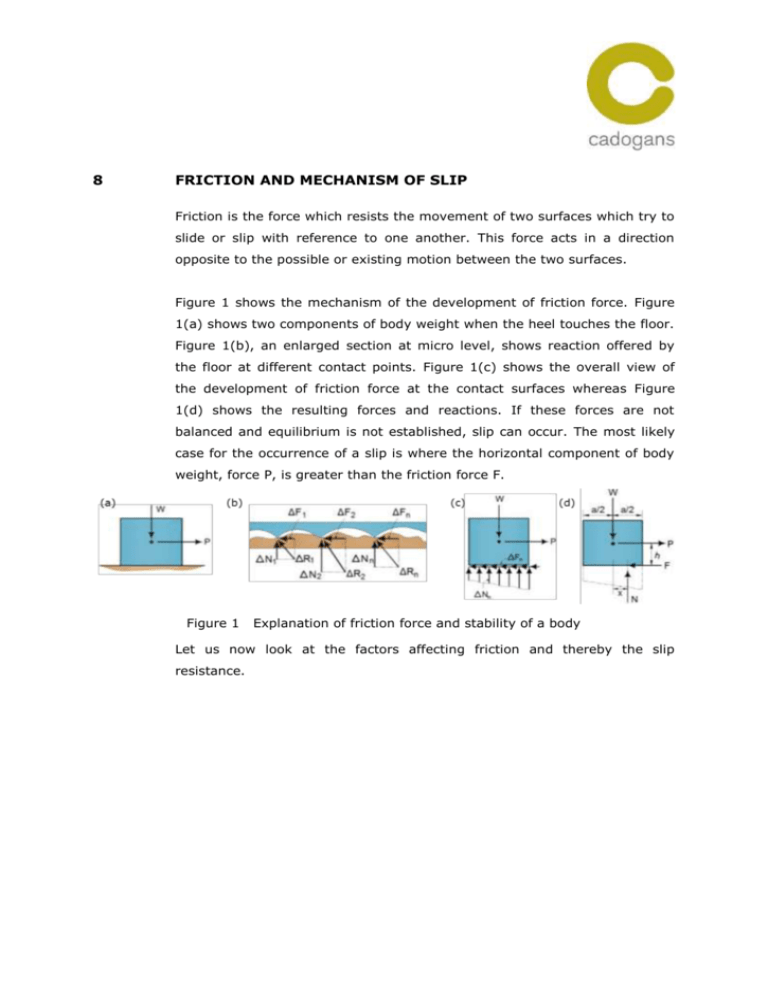
8 FRICTION AND MECHANISM OF SLIP Friction is the force which resists the movement of two surfaces which try to slide or slip with reference to one another. This force acts in a direction opposite to the possible or existing motion between the two surfaces. Figure 1 shows the mechanism of the development of friction force. Figure 1(a) shows two components of body weight when the heel touches the floor. Figure 1(b), an enlarged section at micro level, shows reaction offered by the floor at different contact points. Figure 1(c) shows the overall view of the development of friction force at the contact surfaces whereas Figure 1(d) shows the resulting forces and reactions. If these forces are not balanced and equilibrium is not established, slip can occur. The most likely case for the occurrence of a slip is where the horizontal component of body weight, force P, is greater than the friction force F. Figure 1 Explanation of friction force and stability of a body Let us now look at the factors affecting friction and thereby the slip resistance. 9 FACTORS AFFECTING SLIP RESISTANCE A number of factors affect the slip resistance. Figure 2 shows various factors affecting the slip resistance. Figure 2 Factors affecting slip1 These factors affect the slip resistance jointly and severally. Some of these factors may be either easier to deal with or easier to understand. Others may not be. However, it is important not to get fixated to a factor. 9.1 Effect of Flooring Flooring is probably the most important factor affecting the slip risk. It is therefore important to understand the effect of the type of flooring material, floor finish, profile and, wear and tear over a period of time. Most flooring materials can be broadly divided in two categories – soft and hard flooring. Rubber, vinyl and linoleum are the most common soft floor materials whereas ceramic, stone, epoxy, wood, metal and concrete are some of the most common hard floor materials. Identification of right flooring material at the initial design stage or during refurbishment can help reduce slip risk. Location, type of work, amount of pedestrian usage and, type and amount of contamination are the slip risk related factors which need to be considered at the design stage. 1 http://www.hse.gov.uk/slips/step/ 9.2 Effect of Contamination Contamination plays equally important role in slip resistance. HSE states that almost all slip incidents involve some form of contamination between the floor surface and foot. Most surfaces, when clean and dry, should present a low slip risk2. Contamination could come from spillages, leaks, ingress due to weather, work process or improper cleaning. Identification of source of contamination and controlling/removal of the same should be the highest priority to reduce the slip risk. In many cases, simple engineering solutions or minor changes in the system of work can control/reduce the contamination. Contaminants can be divided in three categories. Fluids – e.g. water, oil, milk etc. Dry – e.g. brck-dust, flour, sand etc. Semi-solids – fruits, chips, dough etc. Slip resistance is affected by the individual properties of each type of contaminant. 9.2.1 Fluid Contaminants Reduction in slip resistance due to a fluid contaminant depends on the surface finish and viscosity (thickness of fluid). Low microroughness is not able to break through the film of the fluid contaminant thereby making the floor slippery (Figure 3). On the other hand, high microroughness breaks through the film of fluid contaminant which, in turn, allows for a solid-tosolid contact with pedestrian’s heel (Figure 4). 2 Defined as a risk of less than one in a million people would have problems walking safely. Figure 3 Low microroughness of the floor can’t break through the fluid contamination which makes the floor slippery3 Figure 4 High microroughness breaks through fluid contamination allowing the floor to offer grip3 The thicker the contaminant, the rougher the floor needs to be to have a low slip risk. 9.2.2 Dry Contaminants Research carried out in last 10-15 years has shown that dry contaminants, similar to their wet counterpart, reduce slip resistance of surfaces. Figure 5 shows general view of interaction between a shoe heel and dry contaminant. Research carried out in last decade has identified three possible mechanisms leading to slip under the influence of dry contaminants. These mechanisms are shown at micro level in Figure 6. 3 http://www.hse.gov.uk/slips/step/ Figure 5 Figure 6 9.2.3 General view of interaction between shoe heel and dry contaminant4 Interaction between shoe heel and dry contaminant at micro level; slip due to (a) sliding, (b) shearing, (c) rolling4 Semi-solid Contaminants Footwear and flooring alone are unlikely to be sufficient to control slip risk due to semi-solid contaminants such as fruits, chips, dough etc. It is therefore important to prevent them getting on the floor in the first place and clean up as soon as possible if they do. 9.3 Importance of Cleaning People rarely slip on clean, dry floors. It is therefore vital to maintain floors in clean and dry condition through effective cleaning regime. Effective cleaning, when carried out well, should remove contamination from the floor and reduce the likelihood of a slip occurring. On the other hand, cleaning, if not carried out effectively, could introduce slip hazards to an environment. Research has shown that cleaning regimes frequently fail to take account of these important points. Well planned cleaning regimes not 4 http://www.hse.gov.uk/slips/step/ only have a positive effect on flooring appearance and hygiene but also reduce likelihood of slip taking place. Different floor types require different cleaning techniques. The most effective technique depends on the type of floor, likely contaminant and the type of activities carried out in the area. Flooring manufacturers and cleaning equipment suppliers can also provide useful information on cleaning regime. It is important to note that a cleaning regime is as good as the people who implement it and the tools they use. 9.4 Effect of Environment Both, external and internal, environments affect the slip resistance. 9.4.1 External environment External surfaces in typical British climate can be routinely wet throughout the year. They could be icy or covered in snow during winter months whereas they could be covered in leaves during autumn. Risk assessed flooring material, cleaning regime, adequate drainage and planning for weather changes can help mitigate slip risks. 9.4.2 Internal environment Humidity and temperature affect the slip resistance of floors whereas factors like lighting and noise affect how people react while walking on a surface. Increased humidity may make a surface damp and slippery whereas low temperatures, such as that in cold storages, can lead to slip hazards. Poor lighting affects people’s ability to spot the hazards on the floor whereas noisy environment can be distracting thereby diverting attention from local slip hazards. 9.5 Effect of Human Factors Ability to understand and react to the instructions, ability to perceive hazard related information, type of activity undertaken, capability, behaviour and fatigue are the most common factors affecting the slip risk. These factors are not always controllable but they could be predictable. 9.6 Importance of Footwear Footwear is an important factor affecting the slip risk. Use of sensible footwear helps reduce the slip risk. Some footwear, such as high heels, smooth soles etc. increase the slip risk and don’t form part of “sensible footwear”5 group. It is important to note that sensible footwear is different from slip resistant footwear. Different types of contaminants require different types of footwear. A slip resistant footwear suitable for wet environment is not necessarily suitable for oils and solid contaminants. Generally a softer sole and close packed tread pattern works well in the indoor environments (Figure 7). A more open tread pattern works better outdoors or in solid contaminants (Figure 8). Figure 7 5 Close packed tread pattern Open-toed shoes, sandals, flip-flops also don’t form part of “sensible footwear” group. Figure 8 Open tread pattern 10 CAN SLIPPERINESS BE MEASURED? Slipperiness is a function of frictional resistance of the surface material. As a result, it is possible to measure the slipperiness of a surface. 10.1 Microroughness test A surface needs to have enough microroughness to break through a contaminant to have a low slip potential (Figure 3, Figure 4). Cadogans uses Surtronic Duo to carry out microroughness measurements. Photograph 1 Surface Roughness meter - Surtronic Duo Surface Texture or roughness is the measurement of the fine frequencies on the surface of a material. Because the surface is made up of a number of frequencies it is important to remove the relevant part of the surface from the profile. For example, if we imagine a desert with sand dunes – the surface form would be the hills and valleys of sand, the waviness would be the rippling in the surface, maybe caused by the effect of the wind and the texture would be the grains of sand themselves. To extract the fine frequency surface roughness we need to apply a filter. One cannot choose the frequency as this has already been done back in the early days of surface measurement and the global standards are now defined. For the majority of surfaces to be checked a 0.8mm (0.030”) is used. This means that only wavelengths that are shorter than 0.8mm pass through the filter. To make a reliable measurement we need to assess a number of these 0.8mm lengths – called the cut offs or assessment lengths. The industry standard is 5. Therefore 0.8mm x 5 gives a measured length of 4mm (see Figure 9). Figure 9 Measurement of surface roughness Due to the way that the filter works it is necessary to actually track across the surface more than 4mm. For instance the globally approved Gaussian filter employed on the Surtronic Duo requires a measurement length of 4.8mm as one of the 0.8mm cut offs is removed as a function of the filter itself. A typical Surtronic Duo actually tracks about 5mm which allows the instrument to get up to a constant measurement speed and complete a 4.8mm measurement. Once the data is collected from the surface, the instrument will apply parameter results to the modified/filtered surface. The Rz parameter favoured by the HSE is calculated by looking at the individual 0.8mm cut offs – each has a peak to valley reading. The five readings are added together and then divided by 5 to give the average peak to valley result. The HSE has specified a Rz roughness value required for a surface according to the type of contaminant. A rougher surface is required for for oils than say water. 10.2 Co-efficient of friction test Co-efficient of friction tests directly measure the slip resistance of a flooring material. A variety of slip tests are available to measure the slip resistance. Three most popular of these tests are: i) Pendulum test ii) Ramp test iii) SlipAlert test Pendulum test is HSE’s preferred method of testing, because it is accurate, portable and works in the condition that slip accidents happen. Cadogans uses Pendulum test to assess the co-efficient of friction of the concerned surface for the following reasons. 10.3 i) It is HSE’s preferred method of testing ii) Pendulum can be used in real workplace conditions. iii) Allows for comparison between clean and contaminated floors. iv) Pendulum simulates frictional resistance of floor while people walk v) Pendulum’s ability to simulate shod and barefoot conditions Pendulum Test HSE and UK Slip Resistance Group (UKSRG) publish guidelines on carrying out slip tests and assessing the test results. The guidelines on assessment of test results follow the research work by Building Research Station (which is now Building Research Establishment (BRE)) in 1950s. The values of slip resistance are read directly from the pendulum scale. They are called pendulum test values (PTV) and are about 100 times greater than the coefficients of friction. Following factors affect the accuracy of pendulum test results. i) Levelling of the pendulum ii) “Setting the zero” iii) Setting the slider’s contact length iv) Preparation/re-preparation of the slider 11 INTERPRETATION OF SLIP RESISTANCE TEST RESULTS 11.1 Microsurface Roughness test results The microroughness meter measures about five millimetres of floor at a time, making the area tested very small, so readings can vary widely as they can be affected by, for example a crack in a tile. An average of ten readings is therefore taken to ensure measurements are more representative of the entire floor. Table 1 shows a relationship between the potential for slip in the wet condition (with clean water) and average of Rz parameter. Table 1 Relationship between Rz parameter and Slip Potential Average Surface Roughness Rz (µm) Below 10 10 to 20 20 + 11.2 Slip Potential High Moderate Low Pendulum test results Figure 10 shows a relationship between slip potential for pedestrians walking on a level surface and PTV. The values change for inclined surfaces. Figure 10 Relationship between PTV and slip potential The HSE classifies slip potential of pedestrians walking in a straight line on a level surface in three categories, low, moderate and high, based on the value of the PTV. This relationship is given in Table 2. Table 2 Relationship between PTV and Slip Potential PTV Slip Potential 0 - 24 High 25 - 35 Moderate 36 + Low 12 WHY IS SLIP SUCH A BIG DEAL More than 30,000 people suffered slip and trip injury while at work during 2011/2012 (http://www.hse.gov.uk/STATISTICS/tables/index.htm). amounts to about 30% of the employment related injuries. Figure 11 HSE statistics based on employment related injuries This 13 CERTIFICATION OF TEST EQUIPMENT It is important to keep the test equipment calibrated to ascertain the accuracy of the test results. Cadogans’ equipment and associated accessories are calibrated and certified either by BSI or UKAS accredited laboratories.


