Math 2 Name Lesson 8-1: Probability Distributions Date Learning
advertisement
Math 2
Lesson 8-1: Probability Distributions
Name ___________________________
Date _________________________
Learning Goals:
I can define and/or identify the following: event, sample space.
I can calculate the probability of an event.
I can determine when a frequency table is an appropriate display for a set of data.
I can construct a frequency table for the data using the appropriate categories for each variable.
Many board games such as the classic, Monopoly, involve rolling two dice to advance one’s game piece.
Getting two sixes is often the best roll for a game. Just how likely is it to roll two sixes?
1. Because of the symmetry in a fair die – each side is equally likely to end up on top when the die is
rolled. Suppose a red die and green die are rolled at the same time.
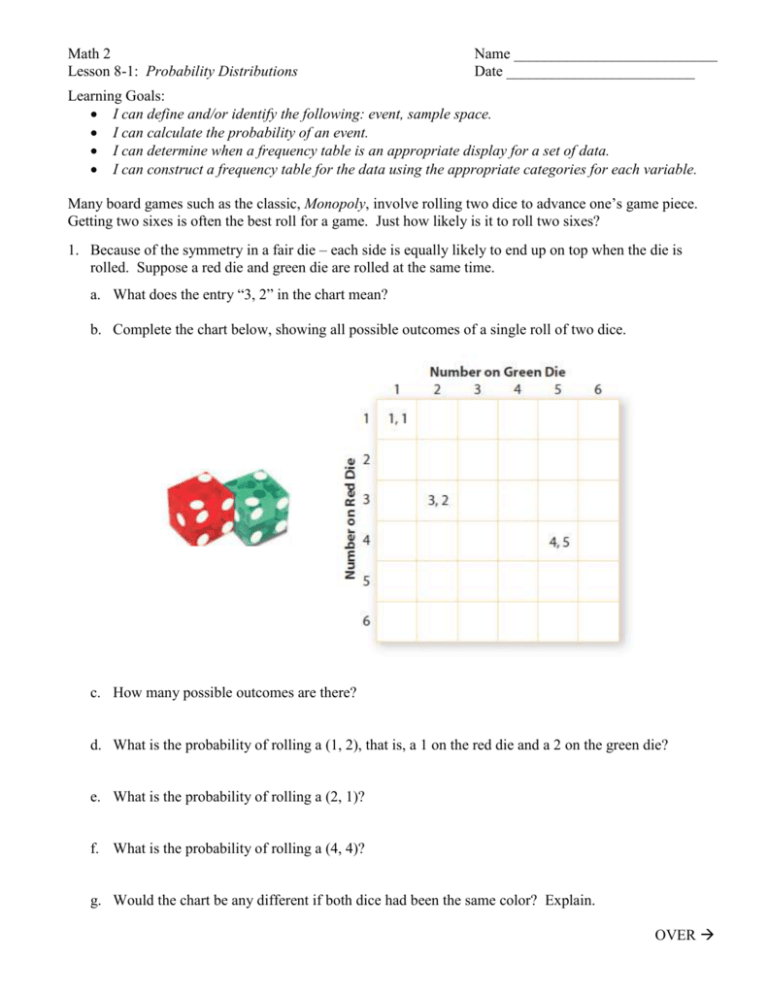
a. What does the entry “3, 2” in the chart mean?
b. Complete the chart below, showing all possible outcomes of a single roll of two dice.
c. How many possible outcomes are there?
d. What is the probability of rolling a (1, 2), that is, a 1 on the red die and a 2 on the green die?
e. What is the probability of rolling a (2, 1)?
f. What is the probability of rolling a (4, 4)?
g. Would the chart be any different if both dice had been the same color? Explain.
OVER
Page 2
The chart you completed in problem 1 is called a sample space for the situation of rolling two dice. A
sample space is a list of all possible outcomes. The outcomes may be categories OR numbers. For fair
dice, all 36 outcomes in the sample space are equally likely to occur. Equally likely means that each
outcome has the same probability.
When outcomes are equally likely, the probability of an event is given by
number of successful outcomes
P( event )
.
number of possibleoutcomes
2. If two dice are rolled, what is the probability of getting . . . . .
a. doubles?
b. a sum of 7?
c. a sum of 11?
d. a 2 on at least one die or a sum of 2?
e. doubles and a sum of 8?
f. doubles or a sum of 8?
3. Suppose two dice are rolled.
a. What is the probability that the sum is no more than 9?
b. What is the probability that the sum is at least 9?
c. What is the probability that the sum is 2 or 3? Is greater than 3? Is at least 3? Is less than 3?
4. A frequency table shows all possible outcomes and the number of times they occur. A probability
distribution shows all possible outcomes and the probability that they occur. Only numbers are allowed
for a probability distribution. Fill in the table below creating a frequency table and probability
distribution.
Sum
2
3
4
5
6
7
8
9
10
11
12
Total
Frequency
Probability
5. How could you use the probability distribution table to find the probability that the sum of two dice is
less than 8?
Page 3
6. Suppose you roll two dice and record the absolute value of the difference of the two numbers.
a. Create a frequency table and probability distribution for this situation.
Absolute Value of
the Difference
Total
Frequency
Probability
b. What is the probability that the absolute value of the difference is 3?
c. What is the probability that the absolute value of the difference is 2 or 3?
d. What is the probability that the absolute value of the difference is no more than 3?
e. What is the probability that the absolute value of the difference is more than 3?
7. If you flip a coin, {heads, tails} is a sample space, but not a probability distribution. Create a probability
distribution table by recording the number of heads as your outcome.
8. Now suppose that you flip a coin twice.
a. Complete a chart that shows the sample space of all possible outcomes. (This should look like the
one for dice on the first page of the packet.)
b. Make a probability distribution table that gives the probability of getting 0, 1, and 2 heads.
c. What is the probability that you get exactly one head if you flip a coin twice? What is the
probability that you get at least one head if you flip a coin twice?
OVER
Page 4
Answers:
Answers:
