Negative and Positive Feedback
advertisement
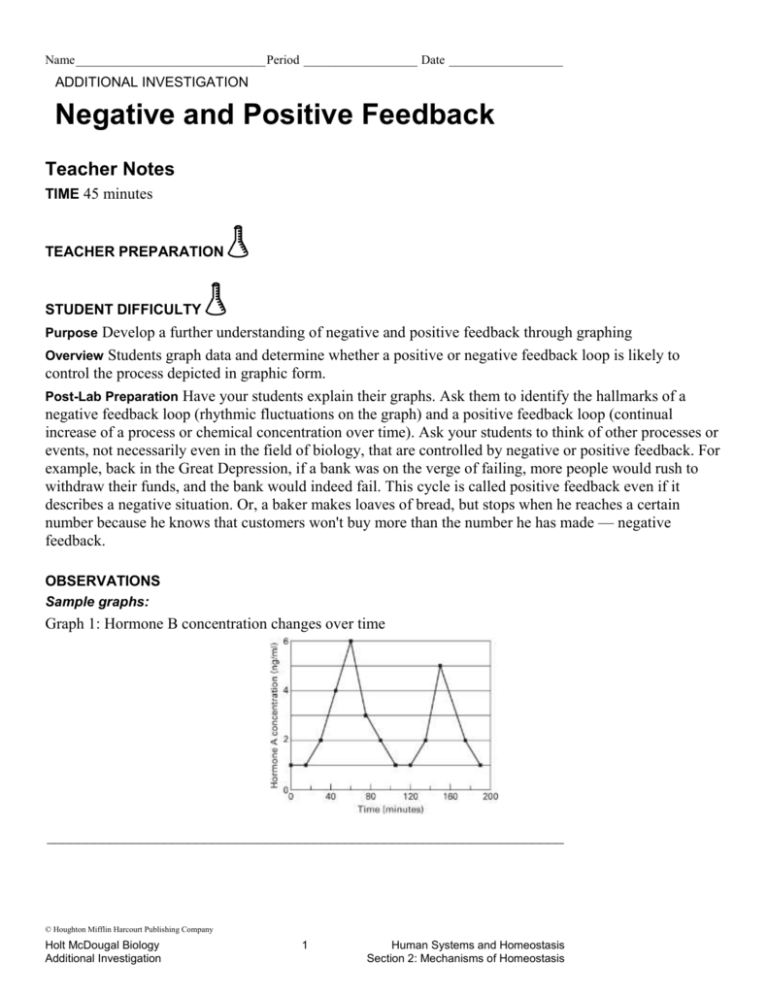
Name ______________________________ Period __________________ Date __________________ ADDITIONAL INVESTIGATION Negative and Positive Feedback Teacher Notes TIME 45 minutes TEACHER PREPARATION STUDENT DIFFICULTY Purpose Develop a further understanding of negative and positive feedback through graphing Overview Students graph data and determine whether a positive or negative feedback loop is likely to control the process depicted in graphic form. Post-Lab Preparation Have your students explain their graphs. Ask them to identify the hallmarks of a negative feedback loop (rhythmic fluctuations on the graph) and a positive feedback loop (continual increase of a process or chemical concentration over time). Ask your students to think of other processes or events, not necessarily even in the field of biology, that are controlled by negative or positive feedback. For example, back in the Great Depression, if a bank was on the verge of failing, more people would rush to withdraw their funds, and the bank would indeed fail. This cycle is called positive feedback even if it describes a negative situation. Or, a baker makes loaves of bread, but stops when he reaches a certain number because he knows that customers won't buy more than the number he has made — negative feedback. OBSERVATIONS Sample graphs: Graph 1: Hormone B concentration changes over time __________________________________________________________________ © Houghton Mifflin Harcourt Publishing Company Holt McDougal Biology Additional Investigation 1 Human Systems and Homeostasis Section 2: Mechanisms of Homeostasis Name ______________________________ Period __________________ Date __________________ Negative and Positive Feedback continued Graph 2: Blood levels of clotting factor X following a wound Graph 3: Glucose levels in blood after eating Graph 4: Blood estrogen in the days before ovulation ANSWERS Analyze and Conclude 1. Both reflect concentration changes in a biochemical substance over time. While the first graph (negative feedback) shows rhythmically fluctuating changes in concentration, the second graph (positive feedback) shows a steady increase in the chemical over time. 2. Blood glucose levels; estrogen levels © Houghton Mifflin Harcourt Publishing Company Holt McDougal Biology Additional Investigation 2 Human Systems and Homeostasis Section 2: Mechanisms of Homeostasis Name ______________________________ Period __________________ Date __________________ Negative and Positive Feedback continued 3. Negative feedback. When the digestive system sends the fullness signal to the brain, the process of eating is momentarily turned off. If it were positive feedback, the signal would be a message to eat more. 4. Negative feedback 5. By periodically reversing the direction of change ( counteracting changes away from set values), negative feedback helps keep many body systems operating within a narrow range. Many homeostatic mechanisms fluctuate within a predictable range to keep the body stable as it responds to a changing environment. © Houghton Mifflin Harcourt Publishing Company Holt McDougal Biology Additional Investigation 3 Human Systems and Homeostasis Section 2: Mechanisms of Homeostasis Name ______________________________ Period __________________ Date __________________ ADDITIONAL INVESTIGATION Negative and Positive Feedback BACKGROUND Negative and positive feedback loops control many physiological functions. In a negative feedback loop, physiological mechanisms work to counteract changes that move internal conditions above or below set values. In contrast, in a positive feedback loop, physiological mechanisms work to increase change away from set values until a particular result is achieved, and homeostasis is restored. Whether or not a process is controlled by negative or positive feedback loops can often be determined by examining graphs of relevant data. In this exercise, you will make graphs using various sets of data. You can then use the graphs to determine whether a positive or negative feedback loop is at work. PROBLEM Does the graph show a negative or positive feedback loop? MATERIALS pencil ruler PROCESS SKILLS Graphing Data Analyzing Data PROCEDURE 1.First, you will graph a function controlled by negative feedback, in this case the release of an animal hormone called PTH which works to regulate calcium levels in the blood. Make a line graph of the data below. In this example, the presence of PTH causes the release of calcium into the blood. The rise in calcium levels then will decrease the amount of PTH. This is a negative feedback loop. Time should be on the x-axis. Label both axes and give your graph a title. © Houghton Mifflin Harcourt Publishing Company Holt McDougal Biology Additional Investigation 4 Human Systems and Homeostasis Section 2: Mechanisms of Homeostasis Name ______________________________ Period __________________ Date __________________ TABLE 1. PTH LEVELS IN THE BLOOD PTH Concentration (ng/mL) Time (min) 1 0 1 15 2 30 4 45 6 60 3 75 2 90 1 105 1 120 2 135 5 150 2 175 1 190 OBSERVATIONS © Houghton Mifflin Harcourt Publishing Company Holt McDougal Biology Additional Investigation 5 Human Systems and Homeostasis Section 2: Mechanisms of Homeostasis Name ______________________________ Period __________________ Date __________________ 2. Look at your graph. Notice there is a pattern of how the hormone level rises and falls. This is characteristic of negative feedback. 3. Make a new line graph of the data in Table 2 that shows a positive feedback system. When you get a cut or scrape, clotting factors in the blood are activated so that they can seal the wound. The activation of some clotting factors increases the amount of other clotting factors. Plot time on the x-axis and label both axes. Title your graph. TABLE 2. BLOOD LEVELS OF CLOTTING FACTOR XII FOLLOWING A WOUND Factor XII Concentration (g/ml) Time After Cut (min) 0.1 0.0 0.2 0.5 0.3 1.0 0.9 2.0 1.2 3.0 1.8 4.0 1.9 5.0 4. Compare this graph to the negative feedback graph. © Houghton Mifflin Harcourt Publishing Company Holt McDougal Biology Additional Investigation 6 Human Systems and Homeostasis Section 2: Mechanisms of Homeostasis Name ______________________________ Period __________________ Date __________________ 5. Construct 2 new graphs from Tables 3 and 4. Use them to determine whether the situations described below are controlled by negative or positive feedback loops. 6. Graph 3: After a meal, the concentration of glucose in a person's blood will start to change from its baseline value, as shown in Table 3. Make another line graph using this data. Plot time on the x-axis. Label the axes and give your graph an appropriate title. TABLE 3. GLUCOSE LEVELS IN THE BLOOD AFTER EATING Blood Glucose Concentration (ng/ml) Time After Eating (minutes) 80 0 130 15 175 30 162 45 150 60 145 75 140 90 119 120 100 150 80 180 © Houghton Mifflin Harcourt Publishing Company Holt McDougal Biology Additional Investigation 7 Human Systems and Homeostasis Section 2: Mechanisms of Homeostasis Name ______________________________ Period __________________ Date __________________ Negative and Positive Feedback continued 7. Graph 4: In females, the levels of the hormone estrogen in the blood peak just prior to ovulation, the release of an egg from the ovary. A rise in estrogen causes the release of a hormone from the brain (luteinizing hormone), which leads to additional increases in estrogen levels. Make another line graph using the data in Table 4. Again, the x-axis should be time. Label the axes and give your graph a title. TABLE 4. BLOOD ESTROGEN LEVELS IN THE DAYS BEFORE OVULATION Estrogen Concentration (pg/ml) Time (days) 50 0 70 1 90 2 120 3 150 4 180 5 190 6 8.Compare your graphs made using Table 3 and Table 4 data. Decide whether positive or negative feedback loops control blood glucose levels. Then decide which type of feedback controls estrogen concentration. Label each graph as positive or negative feedback. © Houghton Mifflin Harcourt Publishing Company Holt McDougal Biology Additional Investigation 8 Human Systems and Homeostasis Section 2: Mechanisms of Homeostasis Name ______________________________ Period __________________ Date __________________ ANALYZE AND CONCLUDE 1. Compare and Contrast How are the graphs of a body chemical controlled by negative feedback and a chemical controlled by positive feedback similar? How are they different? __________________________________________________________________________________ __________________________________________________________________________________ __________________________________________________________________________________ __________________________________________________________________________________ 2. Analyze Which is controlled by a negative feedback loop: blood glucose levels after eating or estrogen levels in the days prior to ovulation? Which is controlled by a positive feedback loop? _________________________________________________________________________________ _________________________________________________________________________________ _________________________________________________________________________________ 3. Infer It's around lunchtime and you are feeling hungry, so you eat a sandwich. When the food passes through your stomach and into your small intestine during digestion, your brain receives a signal causing you to feel full. Consequently, you do not eat any more food. Is this an example of negative or positive feedback? Explain. _________________________________________________________________________________ _________________________________________________________________________________ _________________________________________________________________________________ 4. Infer Mitochondria, the organelles involved in cellular respiration, can also generate chemicals called reactive oxygen species (ROSs). ROSs can damage mitochondria. Damaged mitochondria generate more ROSs than healthy mitochondria. Is this an example of negative or positive feedback? __________________________________________________________________________________ __________________________________________________________________________________ __________________________________________________________________________________ __________________________________________________________________________________ 5. Conclude How is negative feedback related to homeostasis? __________________________________________________________________________________ __________________________________________________________________________________ © Houghton Mifflin Harcourt Publishing Company Holt McDougal Biology Additional Investigation 9 Human Systems and Homeostasis Section 2: Mechanisms of Homeostasis
